Powering the digital medium

Session plan
- 10.00 discussion: what are your concerns regarding climate change?
- 10.30 lecture
- 12.15 exercise
- 12.30 (( break ))
- 15.30 short presentations
- 16.15 wrap-up
You can find the slides for this session here.
Discussion
-
"Please before you print this email consider the impact that it will have in the environment"
-
"This website is powered by renewable energy"
Global warming
The image that opens this session is a visualization of the median global temperatures between 1850-2018, where each year is represented by a coloured stripe.
From showyourstripes.info
The stage
Big Bang Data - Timo Arnall, Internet Machine (trailer) from José Luis de Vicente on Vimeo.
Requesting a piece of data
Typically when we request a piece of content, our computer makes a request, which is just a few bytes long, often containing little more than the address (URL) we want to fetch and then "the internet" sends back a response. As the information travels back and forth in this journey, it engages several systems along the way, all of these systems require electricity to run. No matter what the means of access is, all devices along this chain use electrical power to enable the transit of information.

Normally when browsing the web the response is quite a bit larger (measured in bytes) than the request, unless we are uploading a huge file. This assimmetry can also be observed in our subscription contracts, you will probably have much broader download bandwidths than upload.
The web, if you want to think of it that way, encourages the end user to consume much more information than it produces, it is a protocol that is primarily biased towards consumption of information. Not all protocols are designed this way. In P2P networks, like BitTorrent for example, a good citizen might have ratios of 1:1, meaning that for every byte that the user downloads they upload another one. Some specialized trackers might require that you have 1:4 ratios (meaning that you seed 4 bytes for every byte you download). The average residential internet service contract is thought to cover the basic use case of the web user, download a lot more than upload.
The difficulty of measuring
When we speak of the energy consumption of a specific piece of content, we are not just referring to the energy consumption of our personal devices. There's a whole infrastructure behind the delivery of a single piece of video, much of which also needs to be powered. For you to be able to stream a single Netflix movie, this whole infrastructure must be up and running and the more video we stream the more of this infrastructure we will need. This is an overview of what each of these pieces of infrastructure are:

Delivery is also not the only consumption that must be taken into account, storage, even when a piece of content is not actively being streamed or downloaded, as long as it is online it is using power. Storage power might be passive, but still must be accounted for. The only study available on these estimates that I could find points that keeping 1Gb online uses 5kWh, which is roughly equivalent to a 20Km drive. Consider what the emission equivalent is of your current photo gallery (backed on iCloud?). It is unclear however, how that estimate applies to content in transit or in storage and other revisions provide other consumption calculations.
Measurements
Producing accurate measurements of how much power is consumed in a specific data transfer is very very hard as there are many factors and boundary conditions to consider. Generally the largest impact comes from the age of the equipment used (more modern equipment is on average more power efficient) and the device that is used to consume it, tablet computers and mobile phones are more power efficient than desktop computers. There is not actual consensus on how many units of power (kWh) are used for each unit of data (Gb), estimates range from as high as 5kWh/Gb to as low as 0.027kWh/Gb. Aslan et al. 2018 is a discussion of the most popular methodologies used to calculate this estimate.
For the sake of our exercise today we are going to take a conservative estimate of 0.6kWh per Gigabyte (Gb). With this estimate in mind, shaving off 10Kb off of Youtube's home page, would give us a daily saving of 97 kgCO2e (based on 60M daily pageviews) which is a little less than a return flight between Amsterdam and London 100kgCO2e ( calculator ).
Youtube's logo is about 5Kb on disk (2.2Kb bytes on transfer) and is dispatched to your browser as an inline SVG, this means that your browser doesn't have to hit the server another time to get the logo separately and it being a vector file means that it can resize properly accross different resolutions and pixel densities.
"A music album is in the region of 100 MBytes (a bit more for iTunes, and varies depending on quality and number of tracks of course), which would be 590 Wh. A typical small electric car uses about 300 Wh per mile, so you could drive about 2 miles on the energy required to download and deliver a music album, or do the tea round for 12 people." (source)
The economy of digital content delivery
Content delivery networks (CDNs) and data centers have generally taken matters of performance very seriously, when you are the person that is paying the electricity bill for parts of this infrastructure, how much electricity you spend and how much that electricity costs is an important factor to take into account. However, content creators have not tipically considered the power needed to deliver the product of their work and the whole industry was organized so that they didn't have to care. Most content delivery networks bill content creators per Gb (if they do at all), energy expenses are suposedly factored into that cost.
Data centers use a measure called the PUE or Power usage effectiveness (PUE). It is a ratio that describes how efficiently a computer data center uses energy; specifically, how much energy is used by the computing equipment (in contrast to cooling and other overhead).
Google has a PUE of 1.21, which means that it needs 1.21 kW of power to deliver 1 kW of power to their machines. It is in the interest of the datecenter owner to have as low a PUE as possible as this has an impact in their electricity bill.
Companies that are more vertically integrated, such as Amazon, Facebook or Google, that is, not only do they provide the platforms but they also have their own infrastructure can be significanty impacted by small changes that can have a significant impact in their electricity bill. Think for example that shaving off about 10Kb on Youtube's homepage, given that youtube is visited about 60M times a day could save aproximately 572,2Gb of data traffic which is aproximately 2861kWh in one day, which is the amount of combined power you use in about 6 months of your life.
Flygskam
For the rest of this article I will use a air travel as a comparative framework of reference, so that we can better contextualize what we mean when we say that computers contribute to CO2 emissions.
Flygskam is a swedish word that expresses the feeling of shame derived from flying in an airplane, knowing how much carbon pollution it causes. We need to start thinking of computational energy usage in the same terms.

Flygskam or "flight shame" term of the year?
See this VOX video for more details on the origin of the word and the impact of flight travel.
The elephant in the room: the bitcoin network

Consider for a moment what this means. The Bitcoin network is using (at the present time) more energy than all the schools, all the computers, all the trains, all the homes, all the saunas, all the libraries, all the shopping centers, all the electric heaters, all the universities and all the hospitals in Finland combined. And that's just for one kind of digital asset, and one that mostly benefits a minority of people who actually own Bitcoin. At an expense of CO2 emissions that are shared by the entire planet, rich or poor, owners of Bitcoin or not.
Emissions per capita
- This is the maximum amount of CO2 a person should generate per year to stop climate change: 0.600 t CO2
- This is the average amount of CO2 a person generates in one year in the EU: 8.4 t CO2
from Our World In Data
Study case: Dutch wikipedia

This is the Wikipedia logo, it's 45700 bytes on disk. According to the wikimedia stats for the Dutch wikipedia, the website gets 205M pageviews a month, let's calculate how much it takes to download that logo every time: 8934,49 Gb that's 8.8 TERABYTES, that's about 1517 kgCO2e, you could fly London to Amsterdam, aproximately 35 times on the same carbon budget.
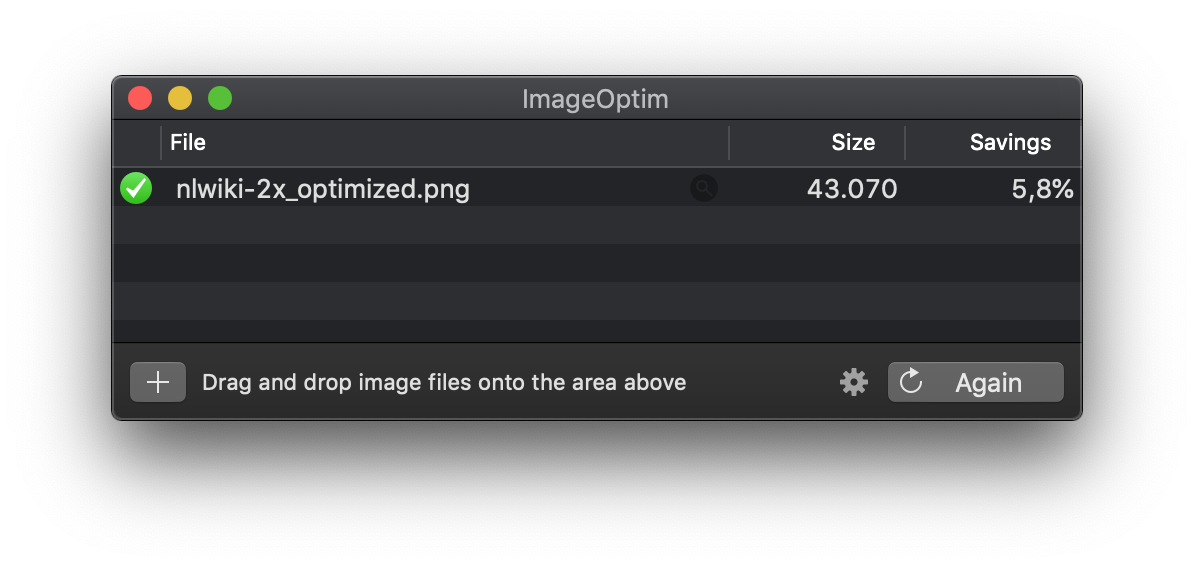

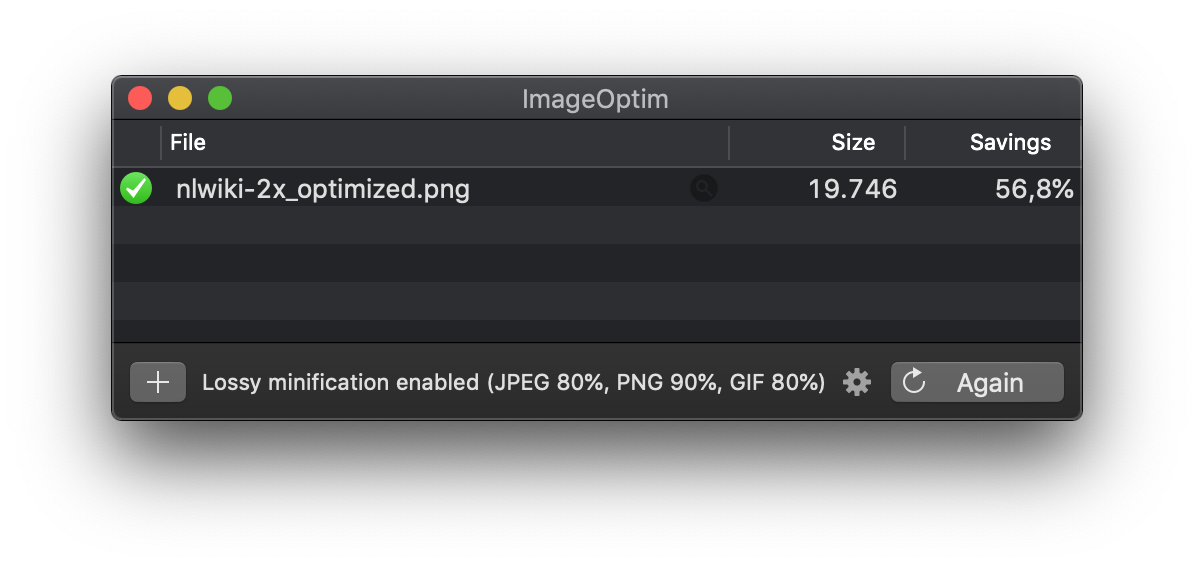


- 45.7 - 19.7 = 26 Kb saved
- 205000000 (impressions per month) * 26 = 5083Gb
- 5083 Gb * 0.7 (cache factor) = 3558,1 Gb
- (3558,1 Gb 0.6 kWh/Gb) 0.28307 kgCo2e/kWh = 604,31 kgCO2e
By using lossy compression on the logo with ImageOptim, we have saved the planet 20 one-way flights London to Amsterdam per month.
Streaming video
About 88% of all web traffic is streaming video, your Herculean efforts to shave off 25Kb of the Wikipedia logo are puny in comparison to the expenditure of watching a Youtube video or binge on Stranger Things on Netflix.
Unlike bitmaps in a website, video streams are never cached by your browser, they are downloaded every time.
This has to do with the way that the system is architected, when you upload a piece of content to the web, you normally place it in a server. Every server has a location and that location is part of the address that you then share on with the people that you want to share that content with. So if I upload a picture to facebook and then want to share it with you, the only way for you to get it is to obtain the address of WHERE the picture is located, this location we call it a URL (Uniform Resource Locator). Whether we are using a chat system like Whatsapp or a social media "shared post", ultimately the people we share with, what they get is this URL. So the curret web publishes content based on its location. Watch Juan Benet from Protocol Labs tell us what the limitations of this model are.
The clip that is relevant for this discussion goes from 13m15s to 15m27s aprox.
The case of Gangnam Style
The original Gangnam Style video by Psy has racked up 3,498,270,983 view as per Jan 2020. The video is 4:12 minutes or 252 seconds. The British Computer Society (BCS) estimate is closer to 312 GWh and the video is still online and continues to accumulate views. That figure is what it takes to power about 68000 homes in the UK for a whole year.
"The starting point for the calculation is the revelation by Google in 2011 (who own YouTube) that streaming 1 minute of video consumes 0.0002 kWh of energy." [3]
And how about Baby Shark... 4.4 billion views in Jan 2020?
A design approach to reducing carbon emissions
Earlier last year a paper was published that analysized the impact of a simple UI change in Youtube that could have far reaching implications in how much carbon the platform emits and save a huge amount of network traffic by simply looking at the way that people streams video and the way in which resources are wasted by not designing for all possible interactions.
"YouTube's annual carbon footprint is about 10Mt CO2e (Million Metric tons of carbon dioxide equivalent), according to researchers — about the output of a city the size of Glasgow. But it doesn't have to be that way, with a few easy design changes easily slashing that footprint by applying Sustainable Interaction Design." [1]
"One design change the researchers do suggest for YouTube and other streaming services is eliminating the "digital waste" of showing video images to users who are only listening to audio — halting that could slash YouTube's carbon footprint by up to 500kt CO2e each year, on par with about 30,000 homes. "In many cases, it would be possible to spot users are doing this and avoid the extra data being sent. For each user, this is not a large quantity, but given the vast number of YouTube users across the planet, the total mounts up."
Immediate versus long term effects
When thinking in terms of sustainability the consequences of a decision might not be immediately impactful, we have to think of consequences as taking effect over a longer term. We might think that by not taking a flight, we do not have any impact because the plane will take off without us anyway, but you have to think of these matters as a longer term overall reduction in the demand for resources.
Chris Preist points to how this argument applies to the network.
"With current network technologies, if you send less data along it, in most cases it doesn’t reduce the energy use. It's like an airplane: if you don’t fly, the plane flies anyway, and so ‘not flying’ only reduces emissions if it leads to less airplanes flying in the long term. However, newer technologies, particularly in the mobile network, will mean that reduced data leads to reduced energy consumption more directly." [1]
Transmitting less data over the wire, means that fewer pieces of equipment will be needed to transmit that data which in exchange will require fewer datacenters, etc. In the case of the web, long term isn't even that long, it is the kind of impact that we can see take effect in our lifetimes. The entire digital infrastructure of the web has been built in the last 20 years.
What can you do as a designer?
If you think that this is important and that you would like to act on it, there are a few things that you can do.
The field of Sustainable Interaction Design is still in it's infancy, there's still much that needs to be understood and many techniques that have not yet been discovered, where young and motivated talent can bring new light.
Take on projects personal or associated with bold clients that give you room to experiment and push the envelope on low-carbon footprint digital services, the field is evolving and there are many economic incentives to move in this direction too.
Look at collectives that are looking for designers that want to engage with this issue, for example: Tech Impact Makers
Re-evaluate your sites
If you are are a developer that has some leverage over some high-traffic sites, you can start by shaving off kilobytes where you don't really need them. Read this blog by Danny van Kooten to see how he decided to do this himself by optimizing his Wordpress plugins for lower energy impact.
Some useful tools
In your process and budgetting of resources, use measuring tools to assess the impact of your design decisions:
- websitecarbon.com a good start but doesn't address all the metrics to accurately estimate impact.
- Understand where your electricity comes from
- This is the best guide on image compression for the web, learn what's there: https://images.guide/
- https://speedcurve.com
- https://www.performancebudget.io/ we need something like this, but for energy impact budgets.
- Use SVG graphics whenever possible, they compress well and use relatively little resources and are easy to include in responsive designs.
- If you must absolutely include bitmap images, use image-optimizing CDNs, here are a few:
- https://tiny.pictures/
- https://imagekit.io/
- https://kraken.io/
- or have one image optimiziner installed in your own computer: https://imageoptim.com
- or include one in your frontend toolchain
gulp-imageminortrimagewill do a good job
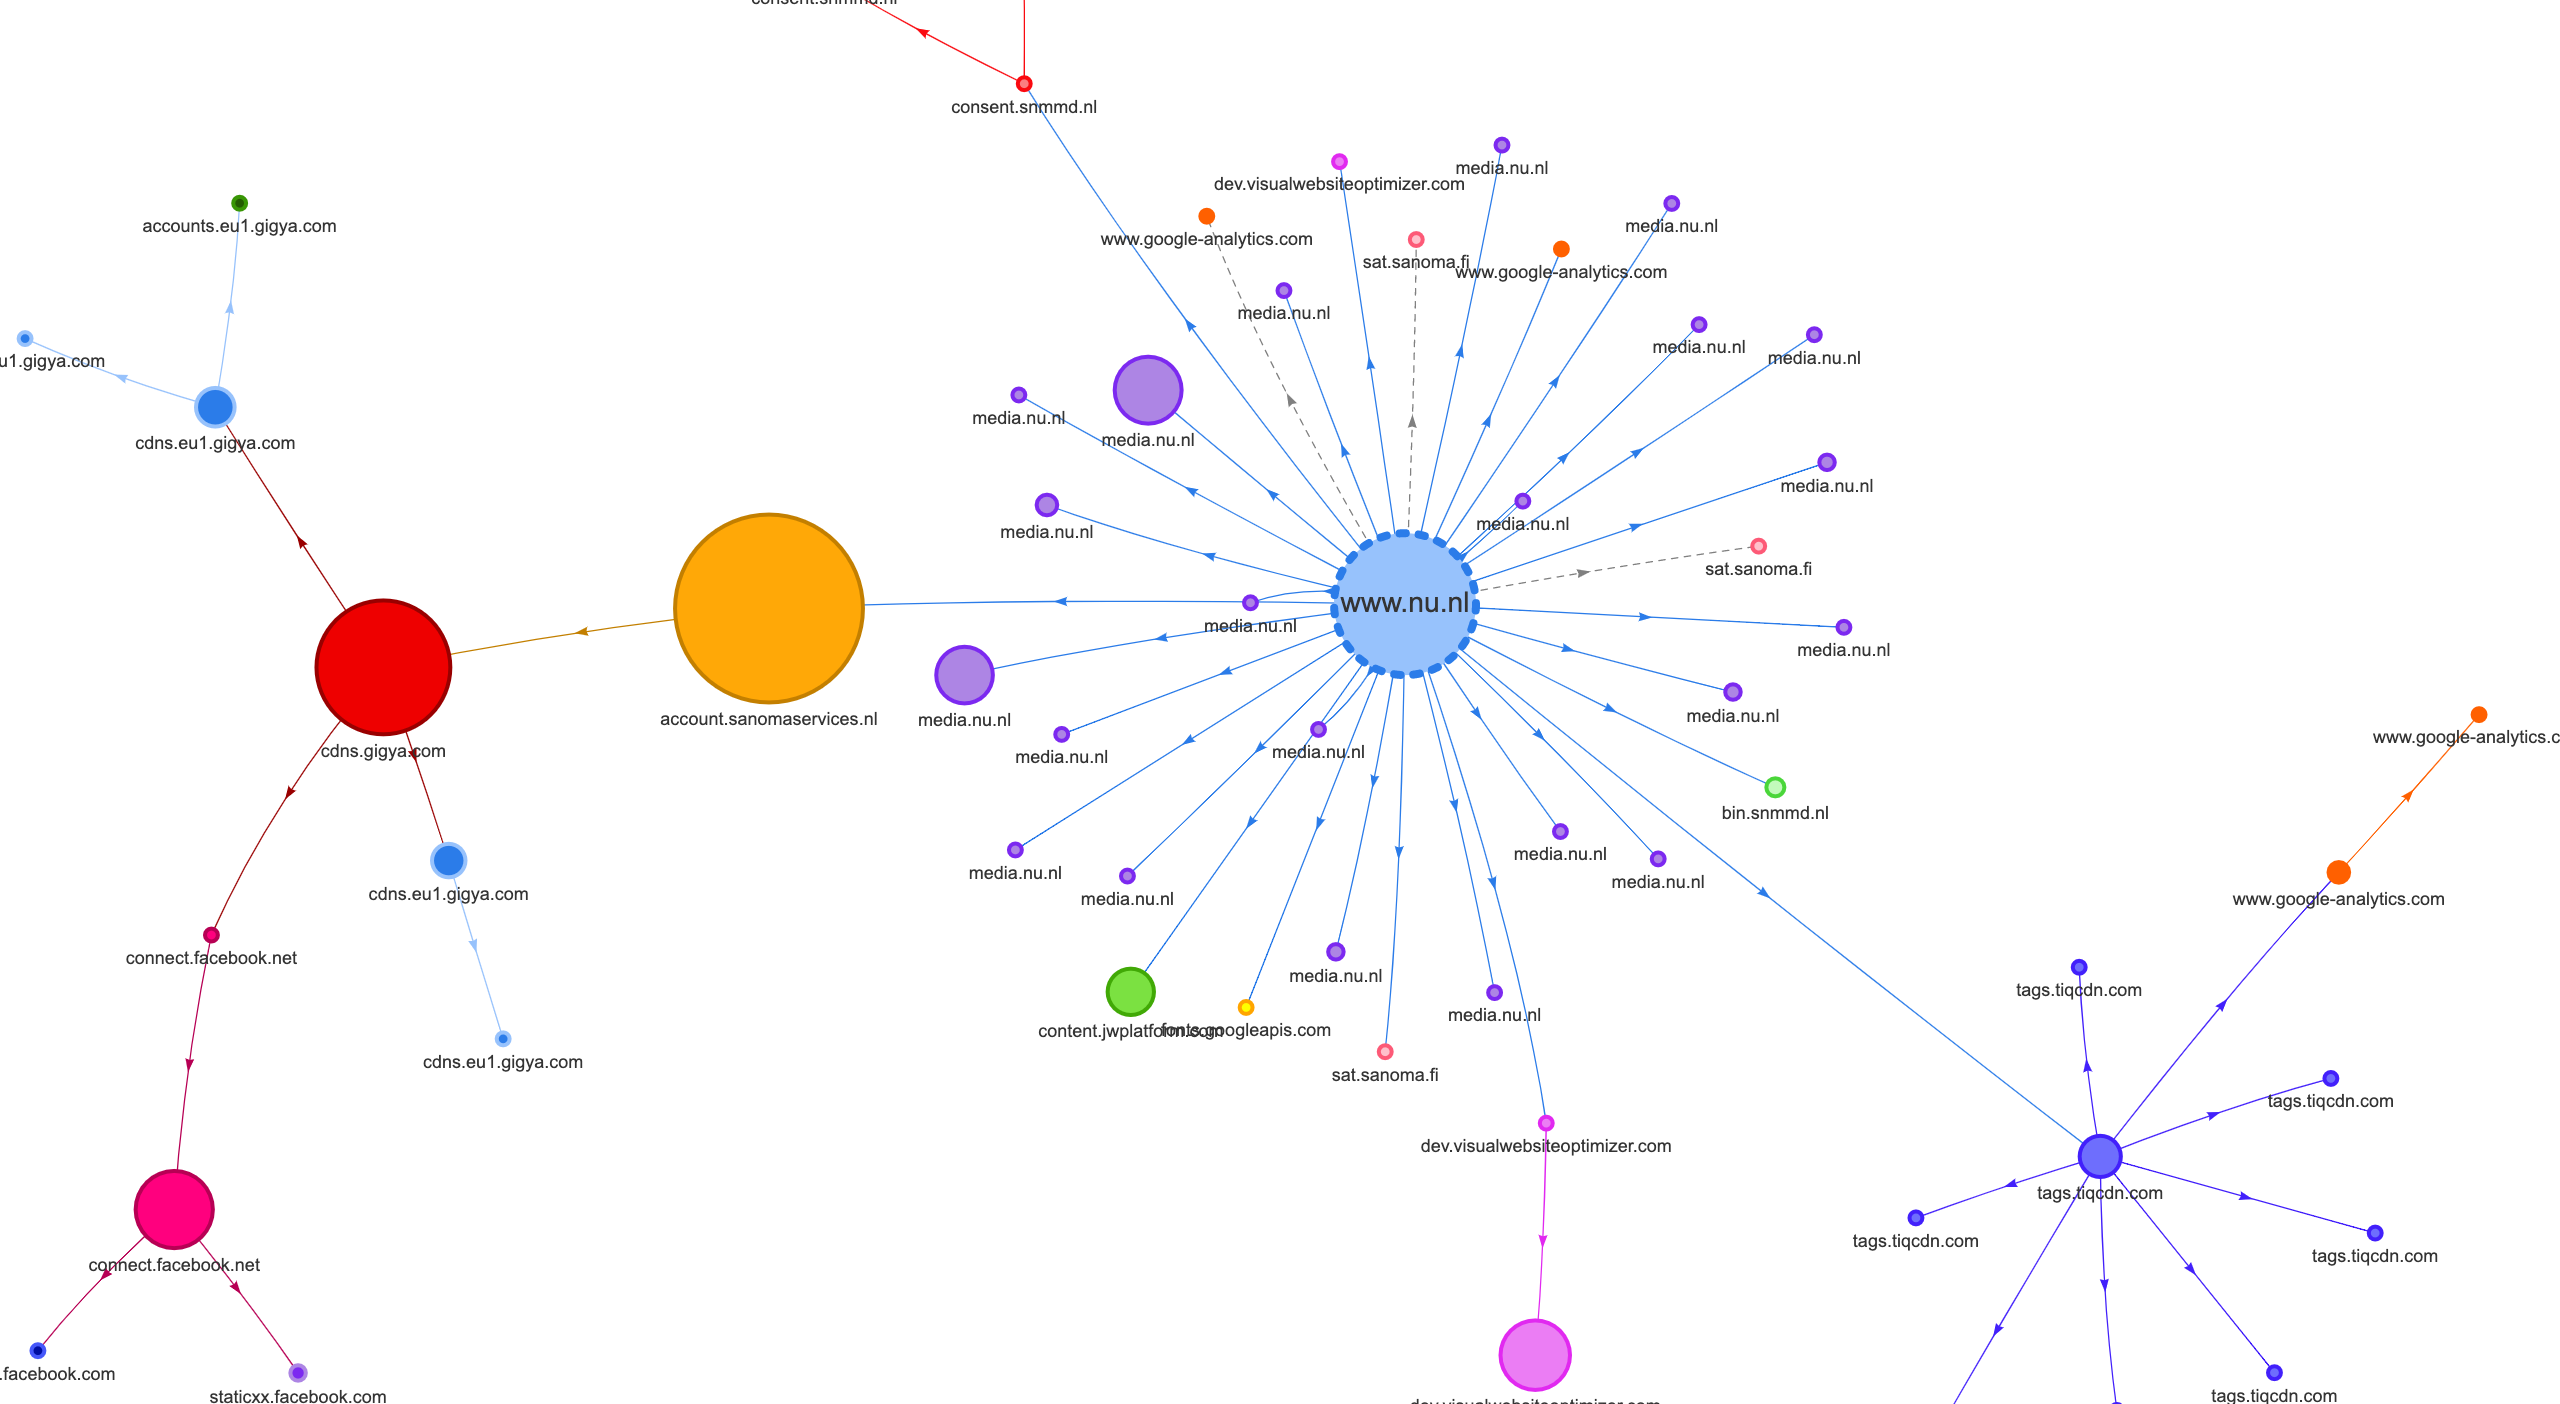
- map the requests that a website makes, understand your third-party dependencies: requestmap
External resources
Third party dependencies can really blow-up your energy budget, have a look for example at the request map of nu.nl. In order to present the wep page at nu.nl to your in your browser, your borwser must fetch resources from all these different places. This is often the case with media that use advertisements, etc.
Choose service providers that use 100% renewables
In November 2019 Amazon made a call for services to move to their cloud platform with the claim that it signifies a carbon reduction apportunity. While this report looks at their total numbers, it turns out that depending on which location you chose to host your service within AWS your application will have a different carbon footprint. This has to do with where Amazon gets its own electricity.
This is a map with AWS locations, notice how not all of them use renewable energy. When chosing a cloud provider for your services make sure that the provider meets your energy budget requirements.

Only the regions with a green leaf are carbon neutral, the rest use power from non-renewable sources.
Take work that will allow you to experiment
Every now and then you can take a project that allows you to do something more experimental. Something that allows you to push the envelope on the kinds of things you can design with energy budgets that you are proud to stand by. Research on sustainable UX is barely a couple of years old, there's plenty to do still that has never been done before.
- Include sustainability in digital design as part of your pitches (even when the client doesn't call for it explicitly)
- Include an energy budget in all your proposals
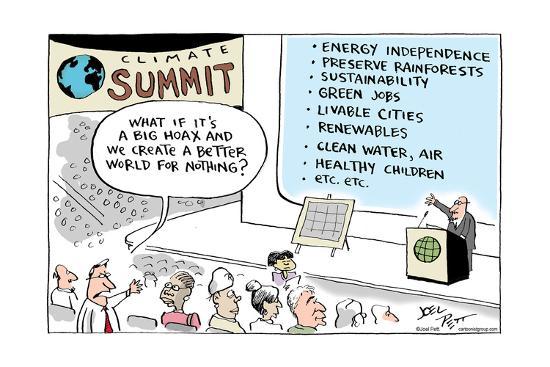
What if?
Case studies
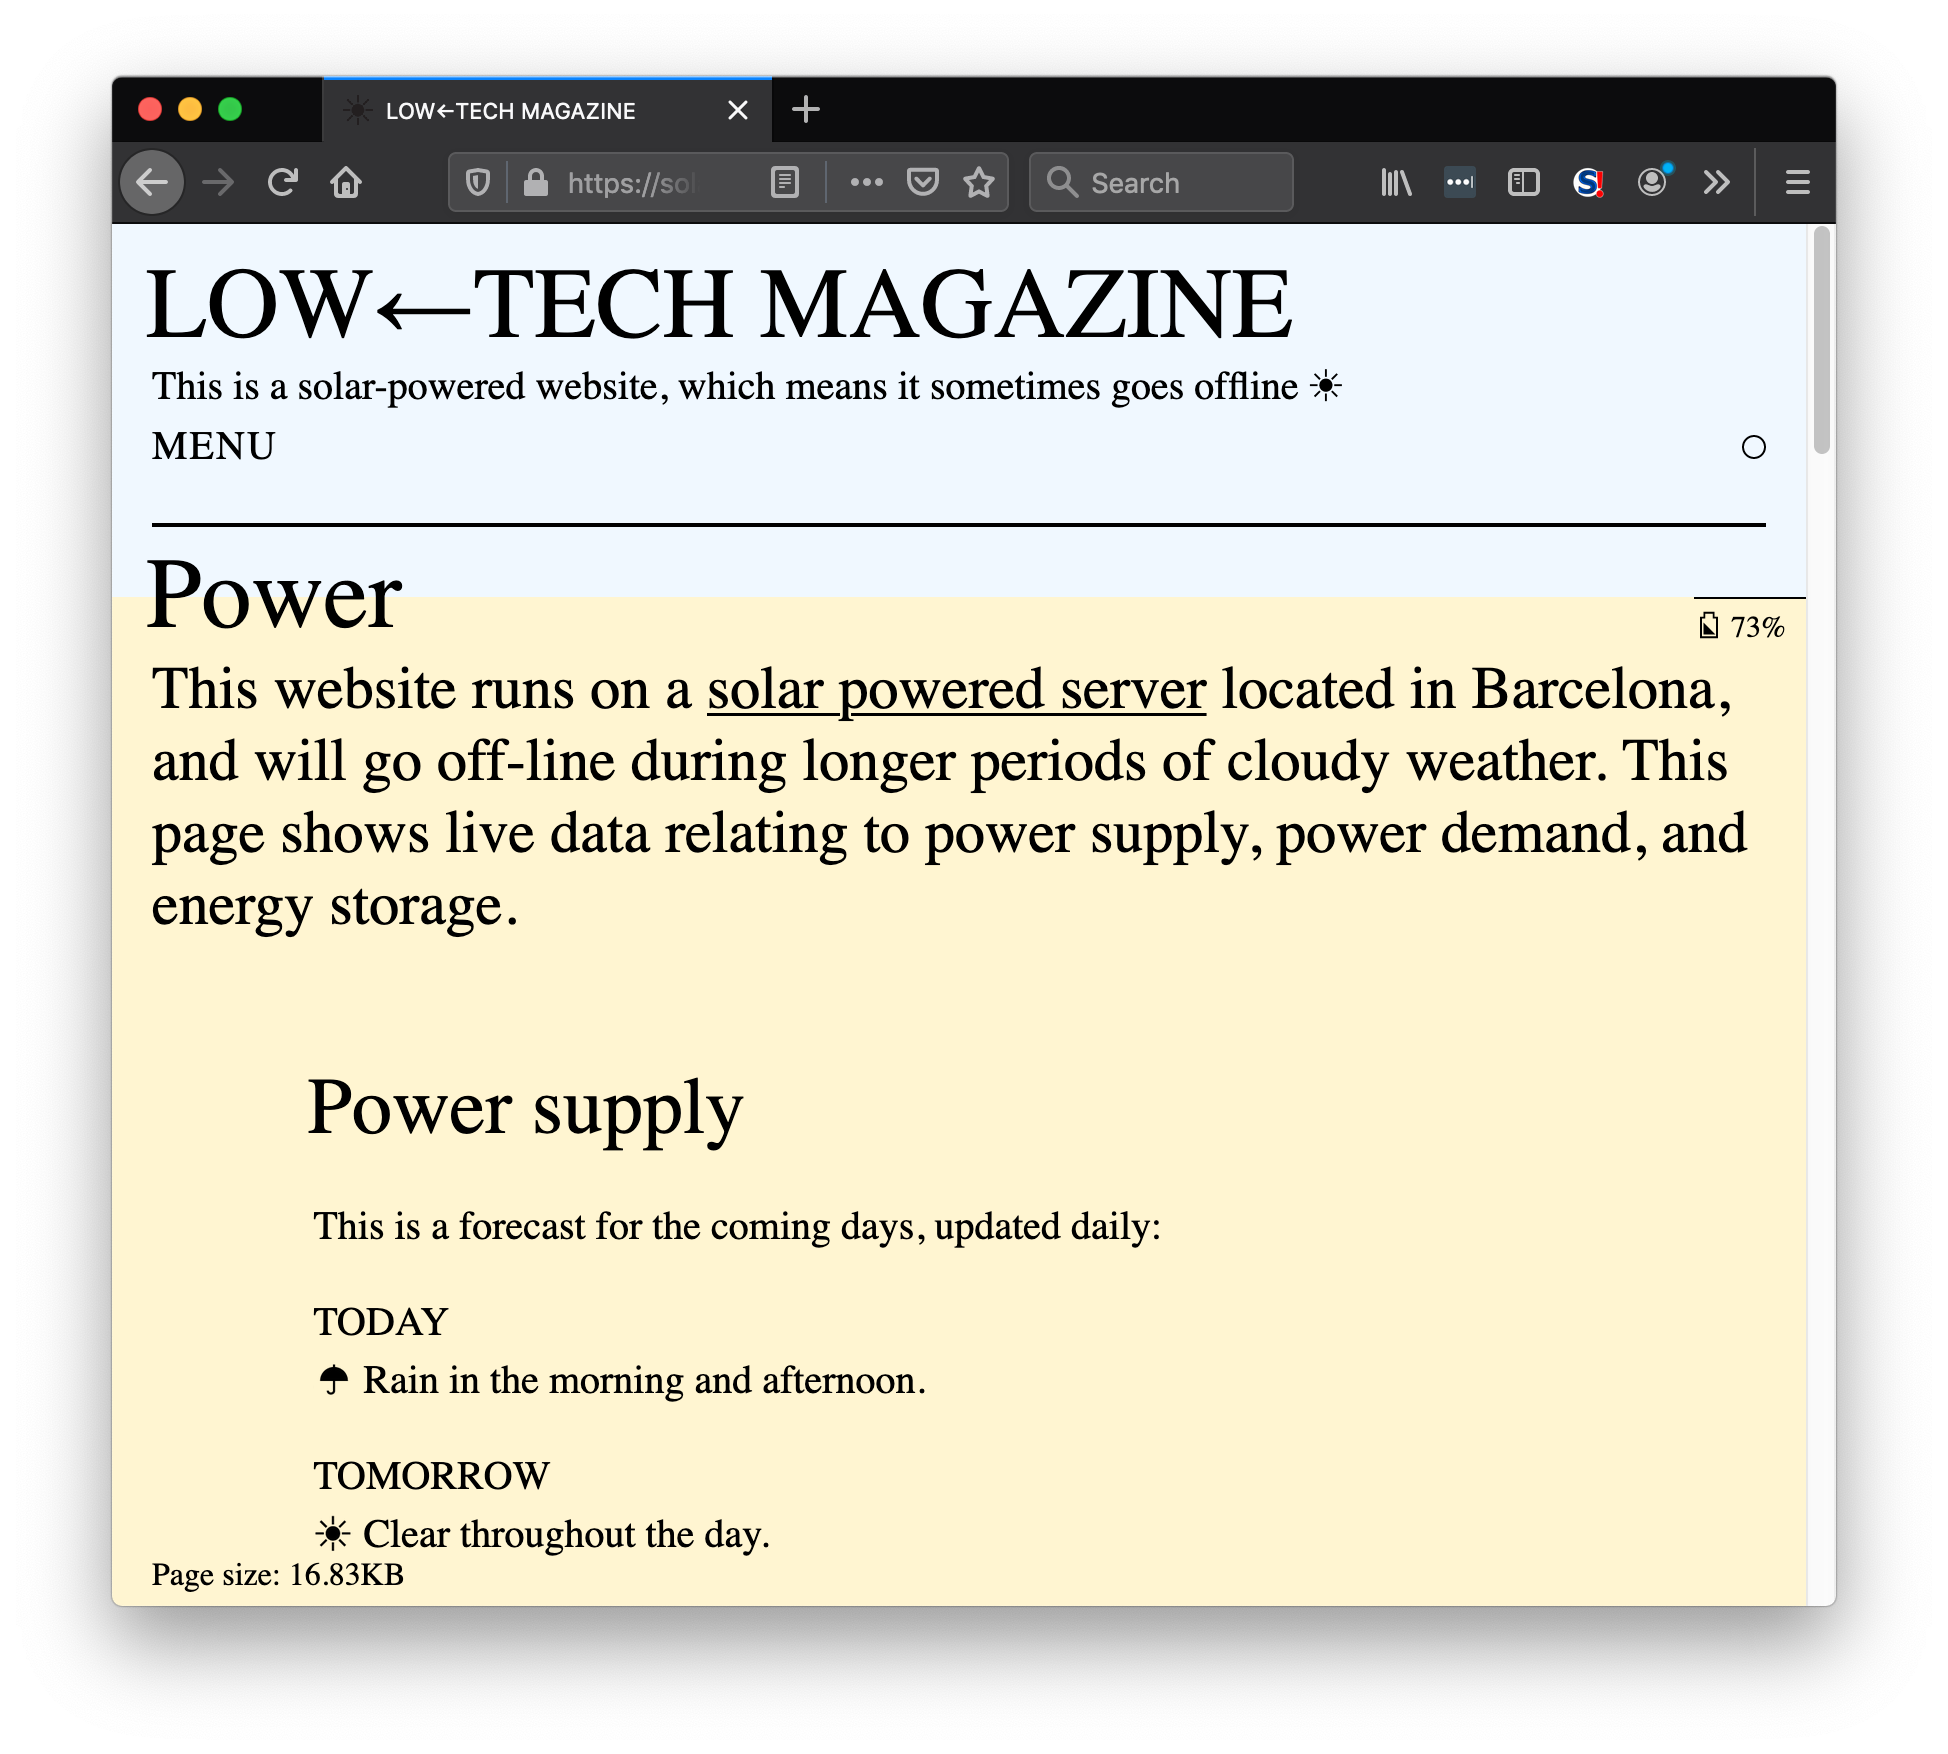
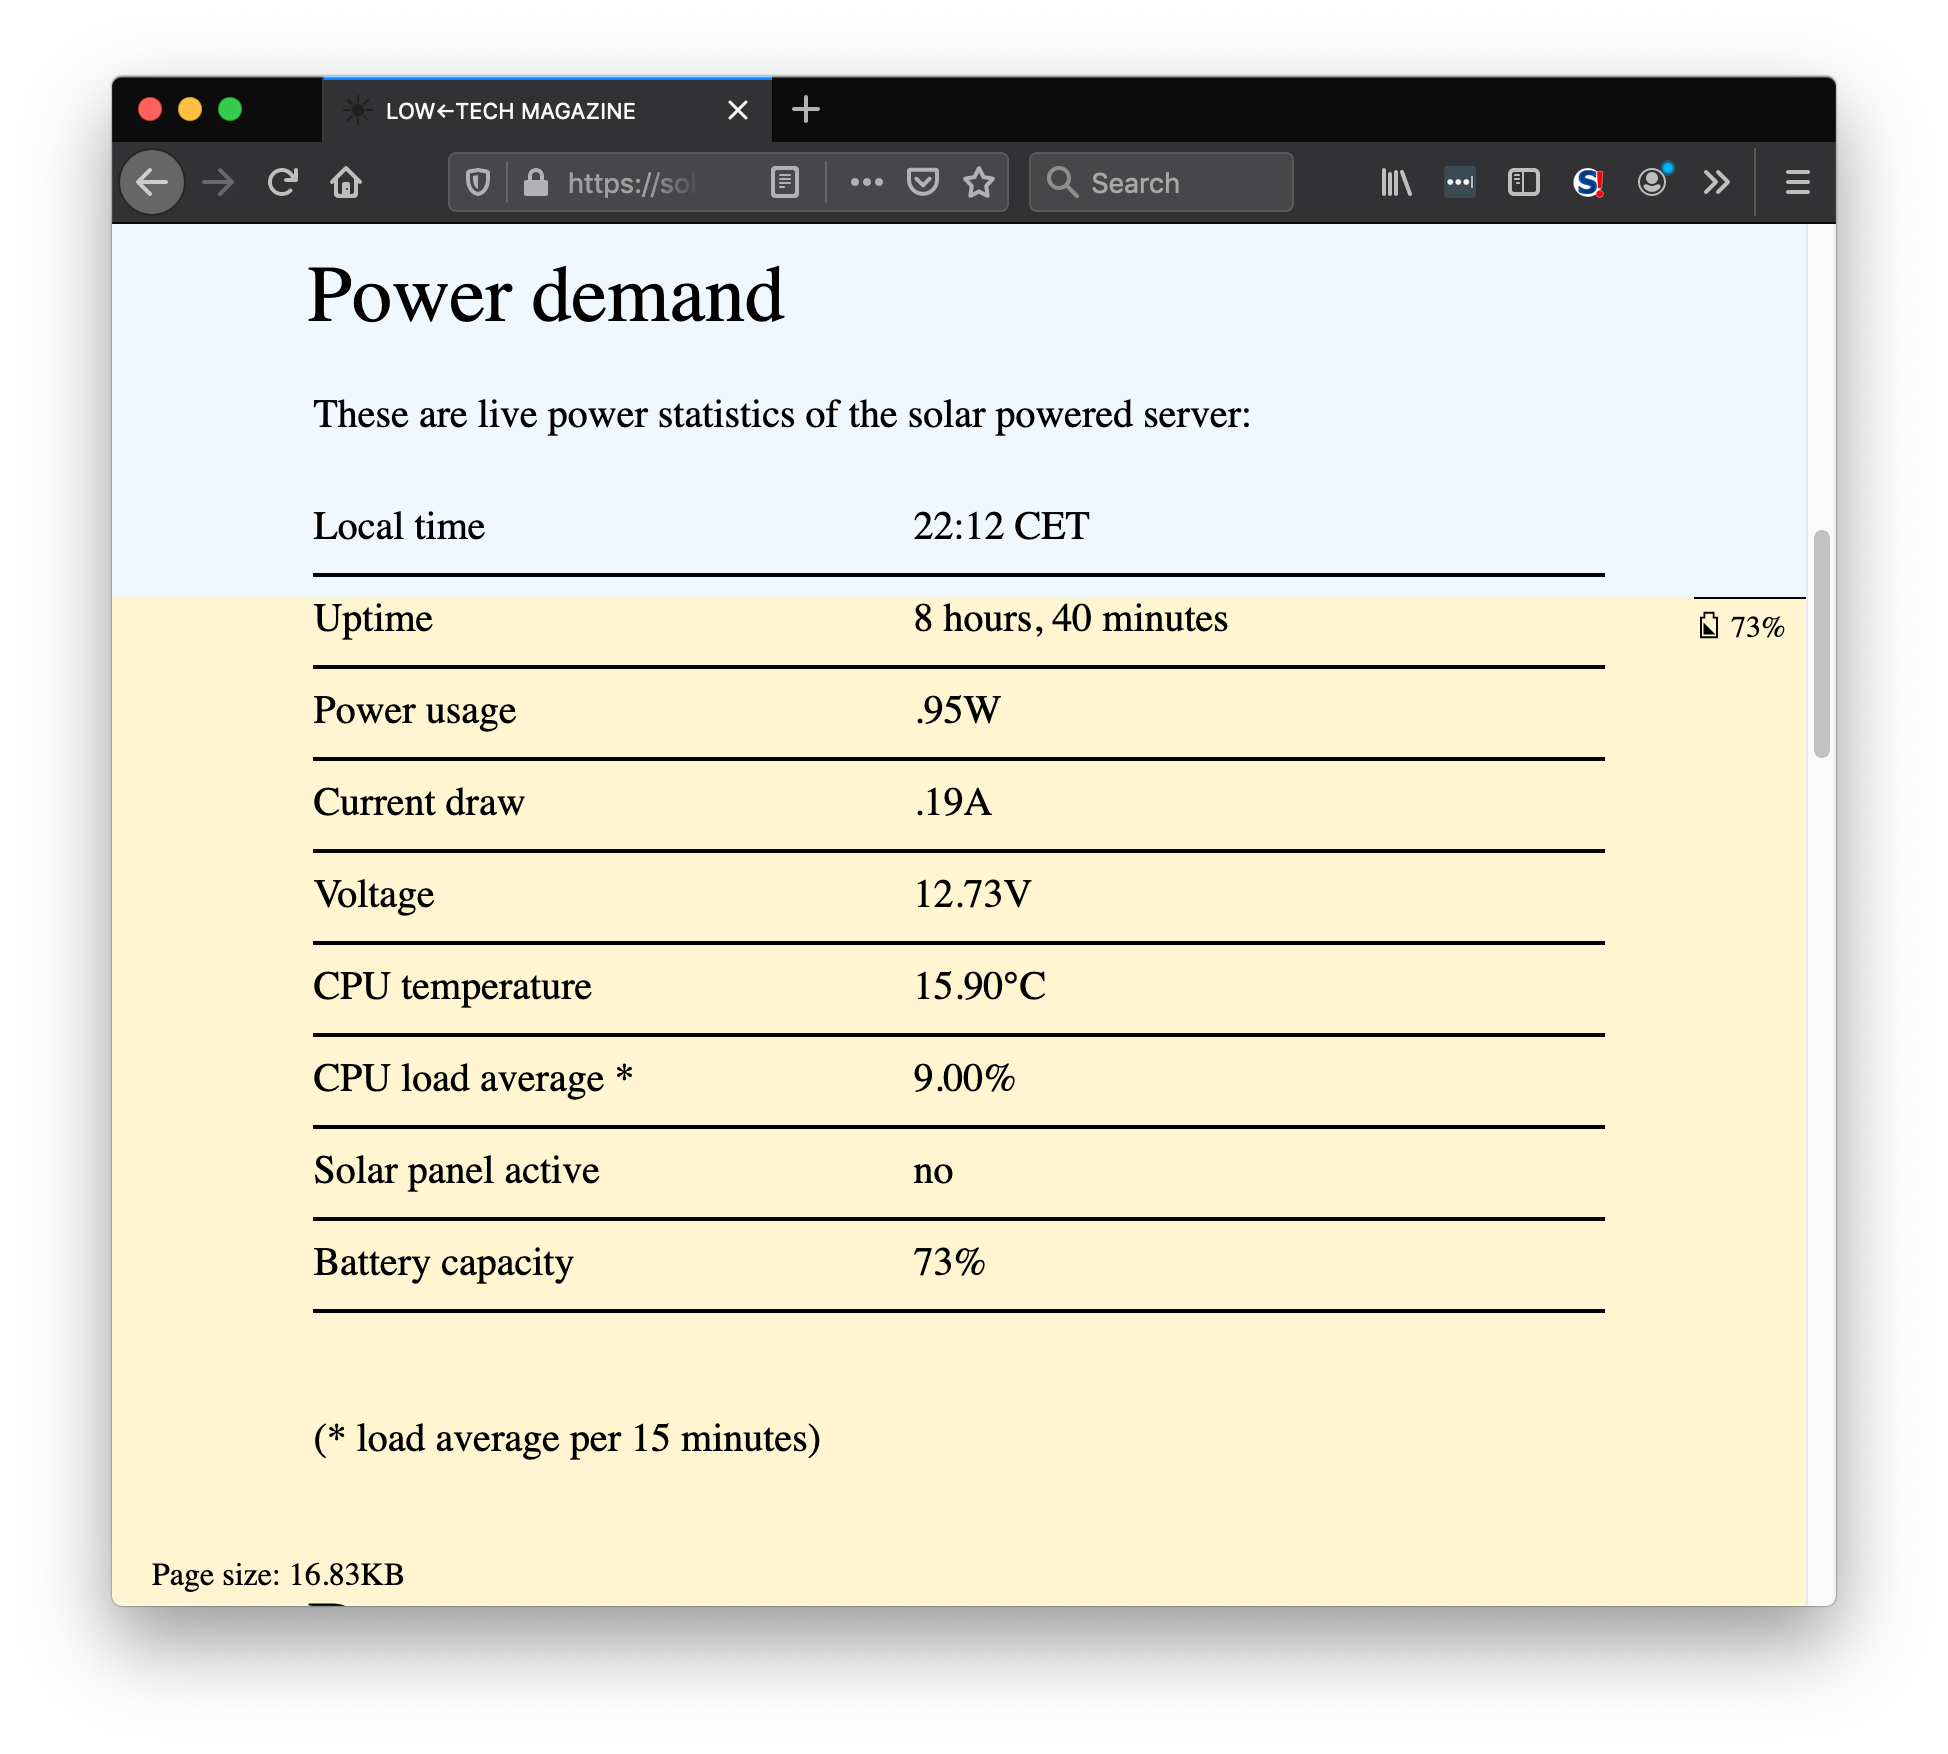
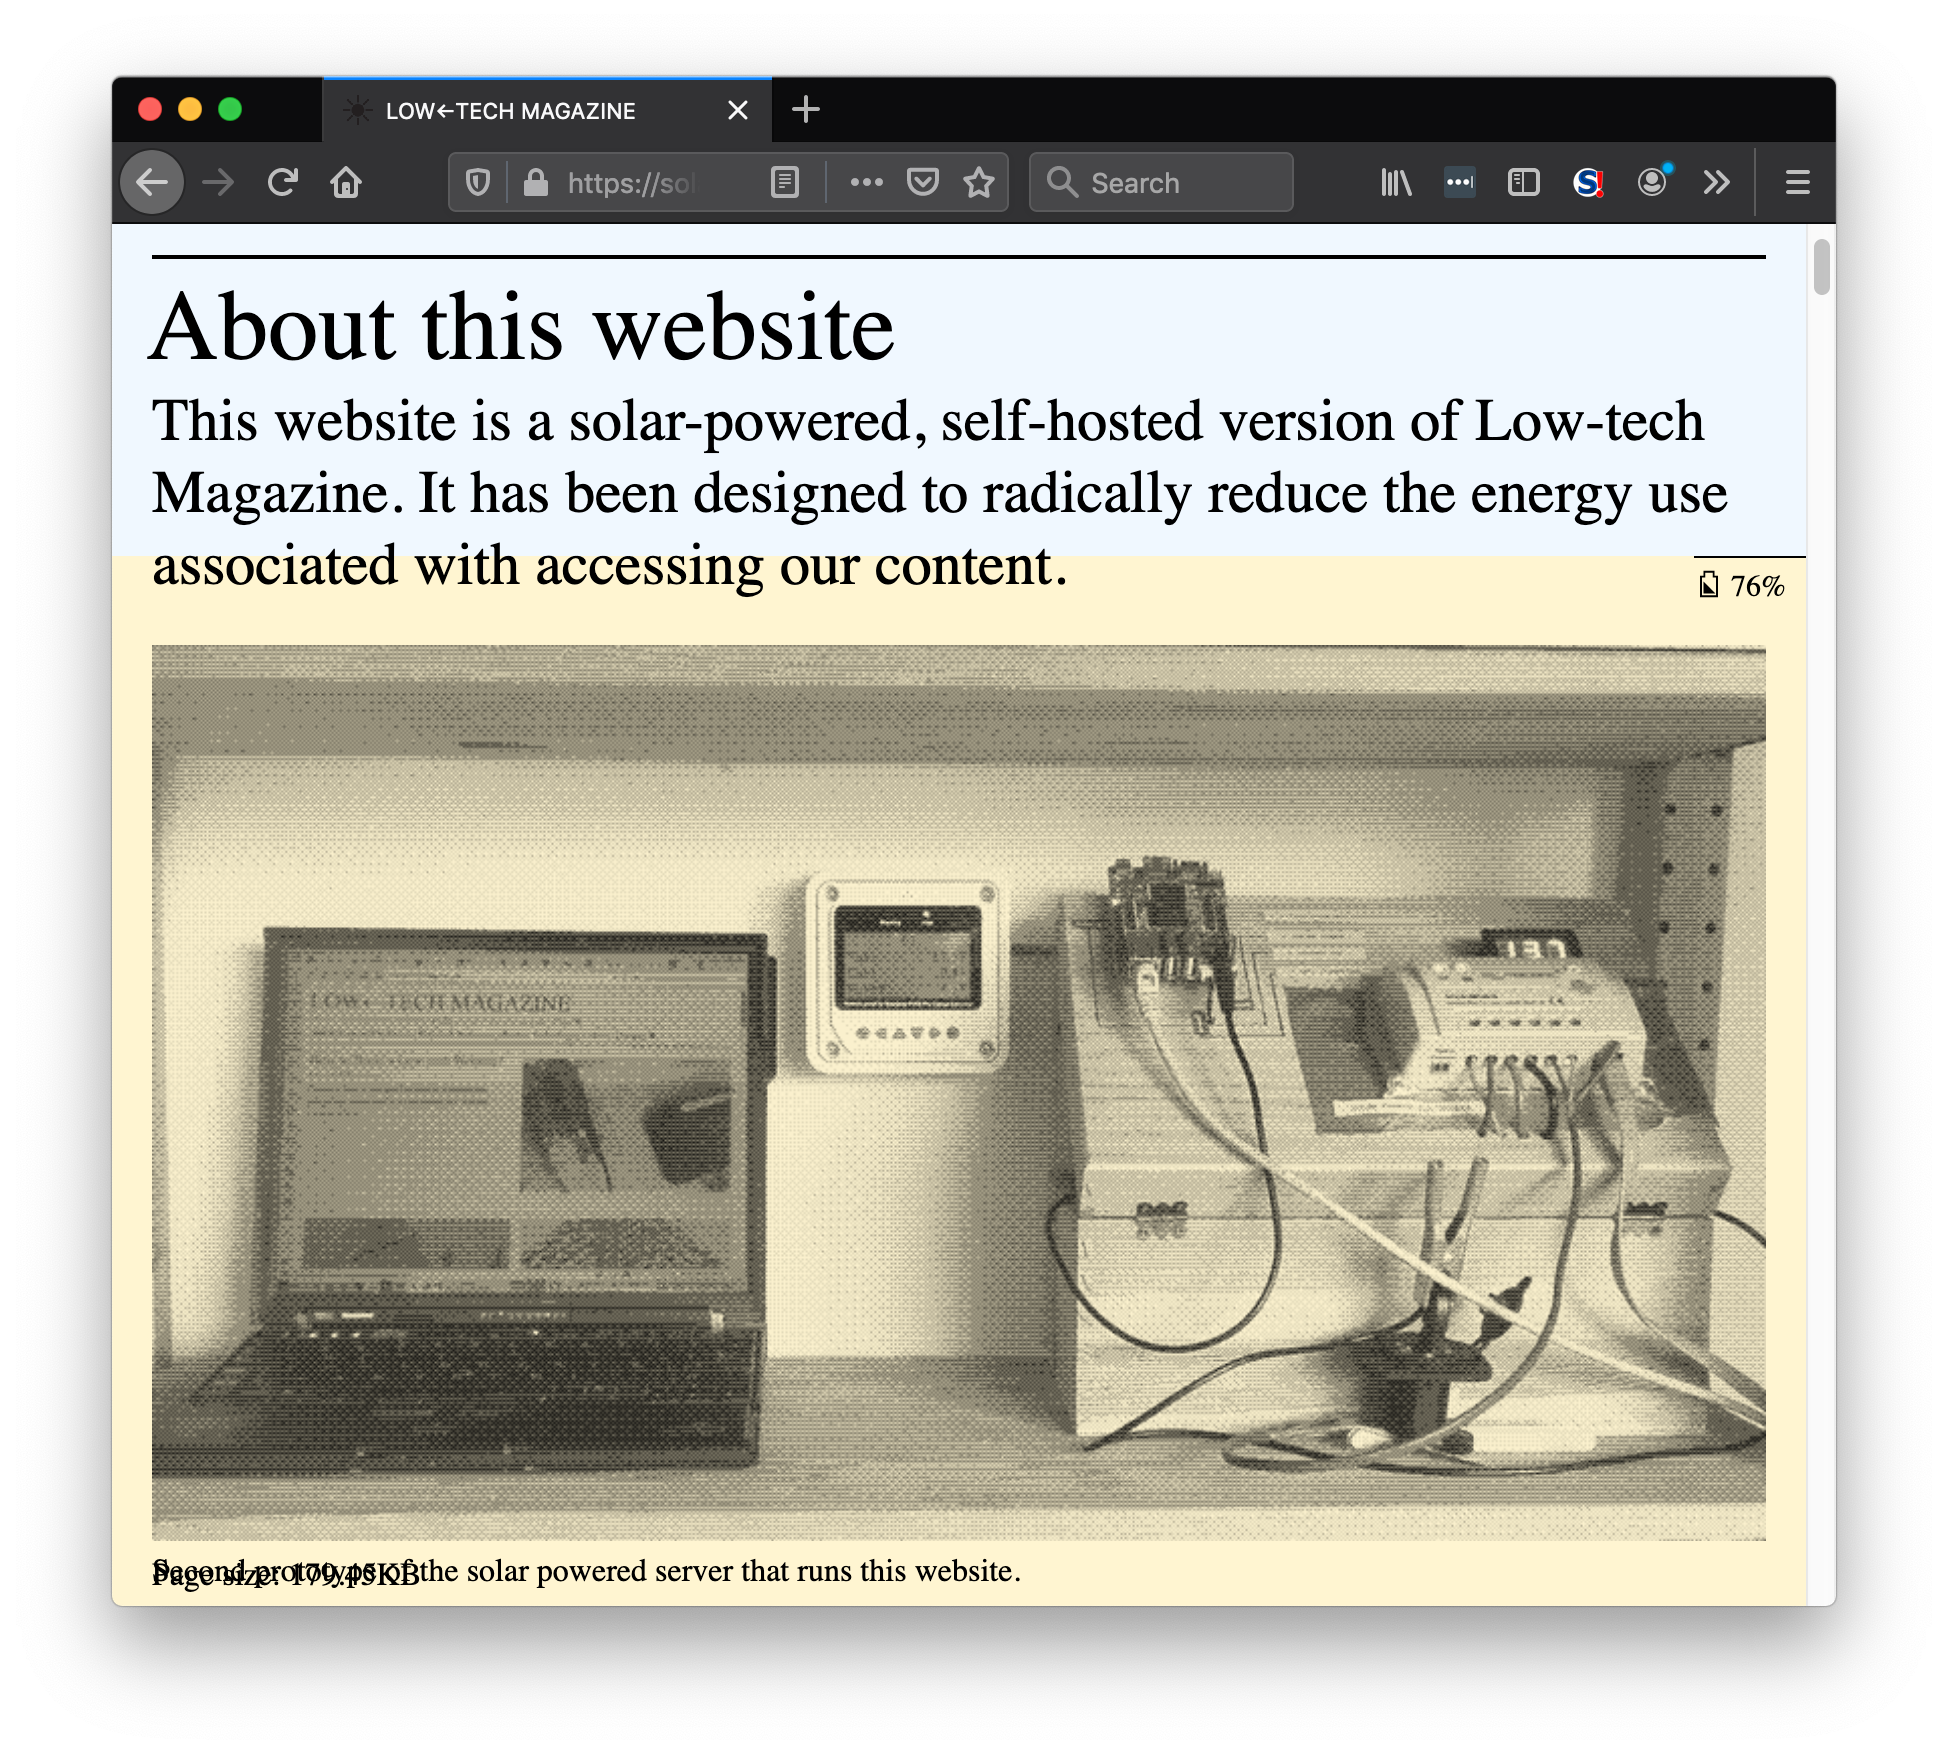
Case study: solar.lowtechmagazine.com
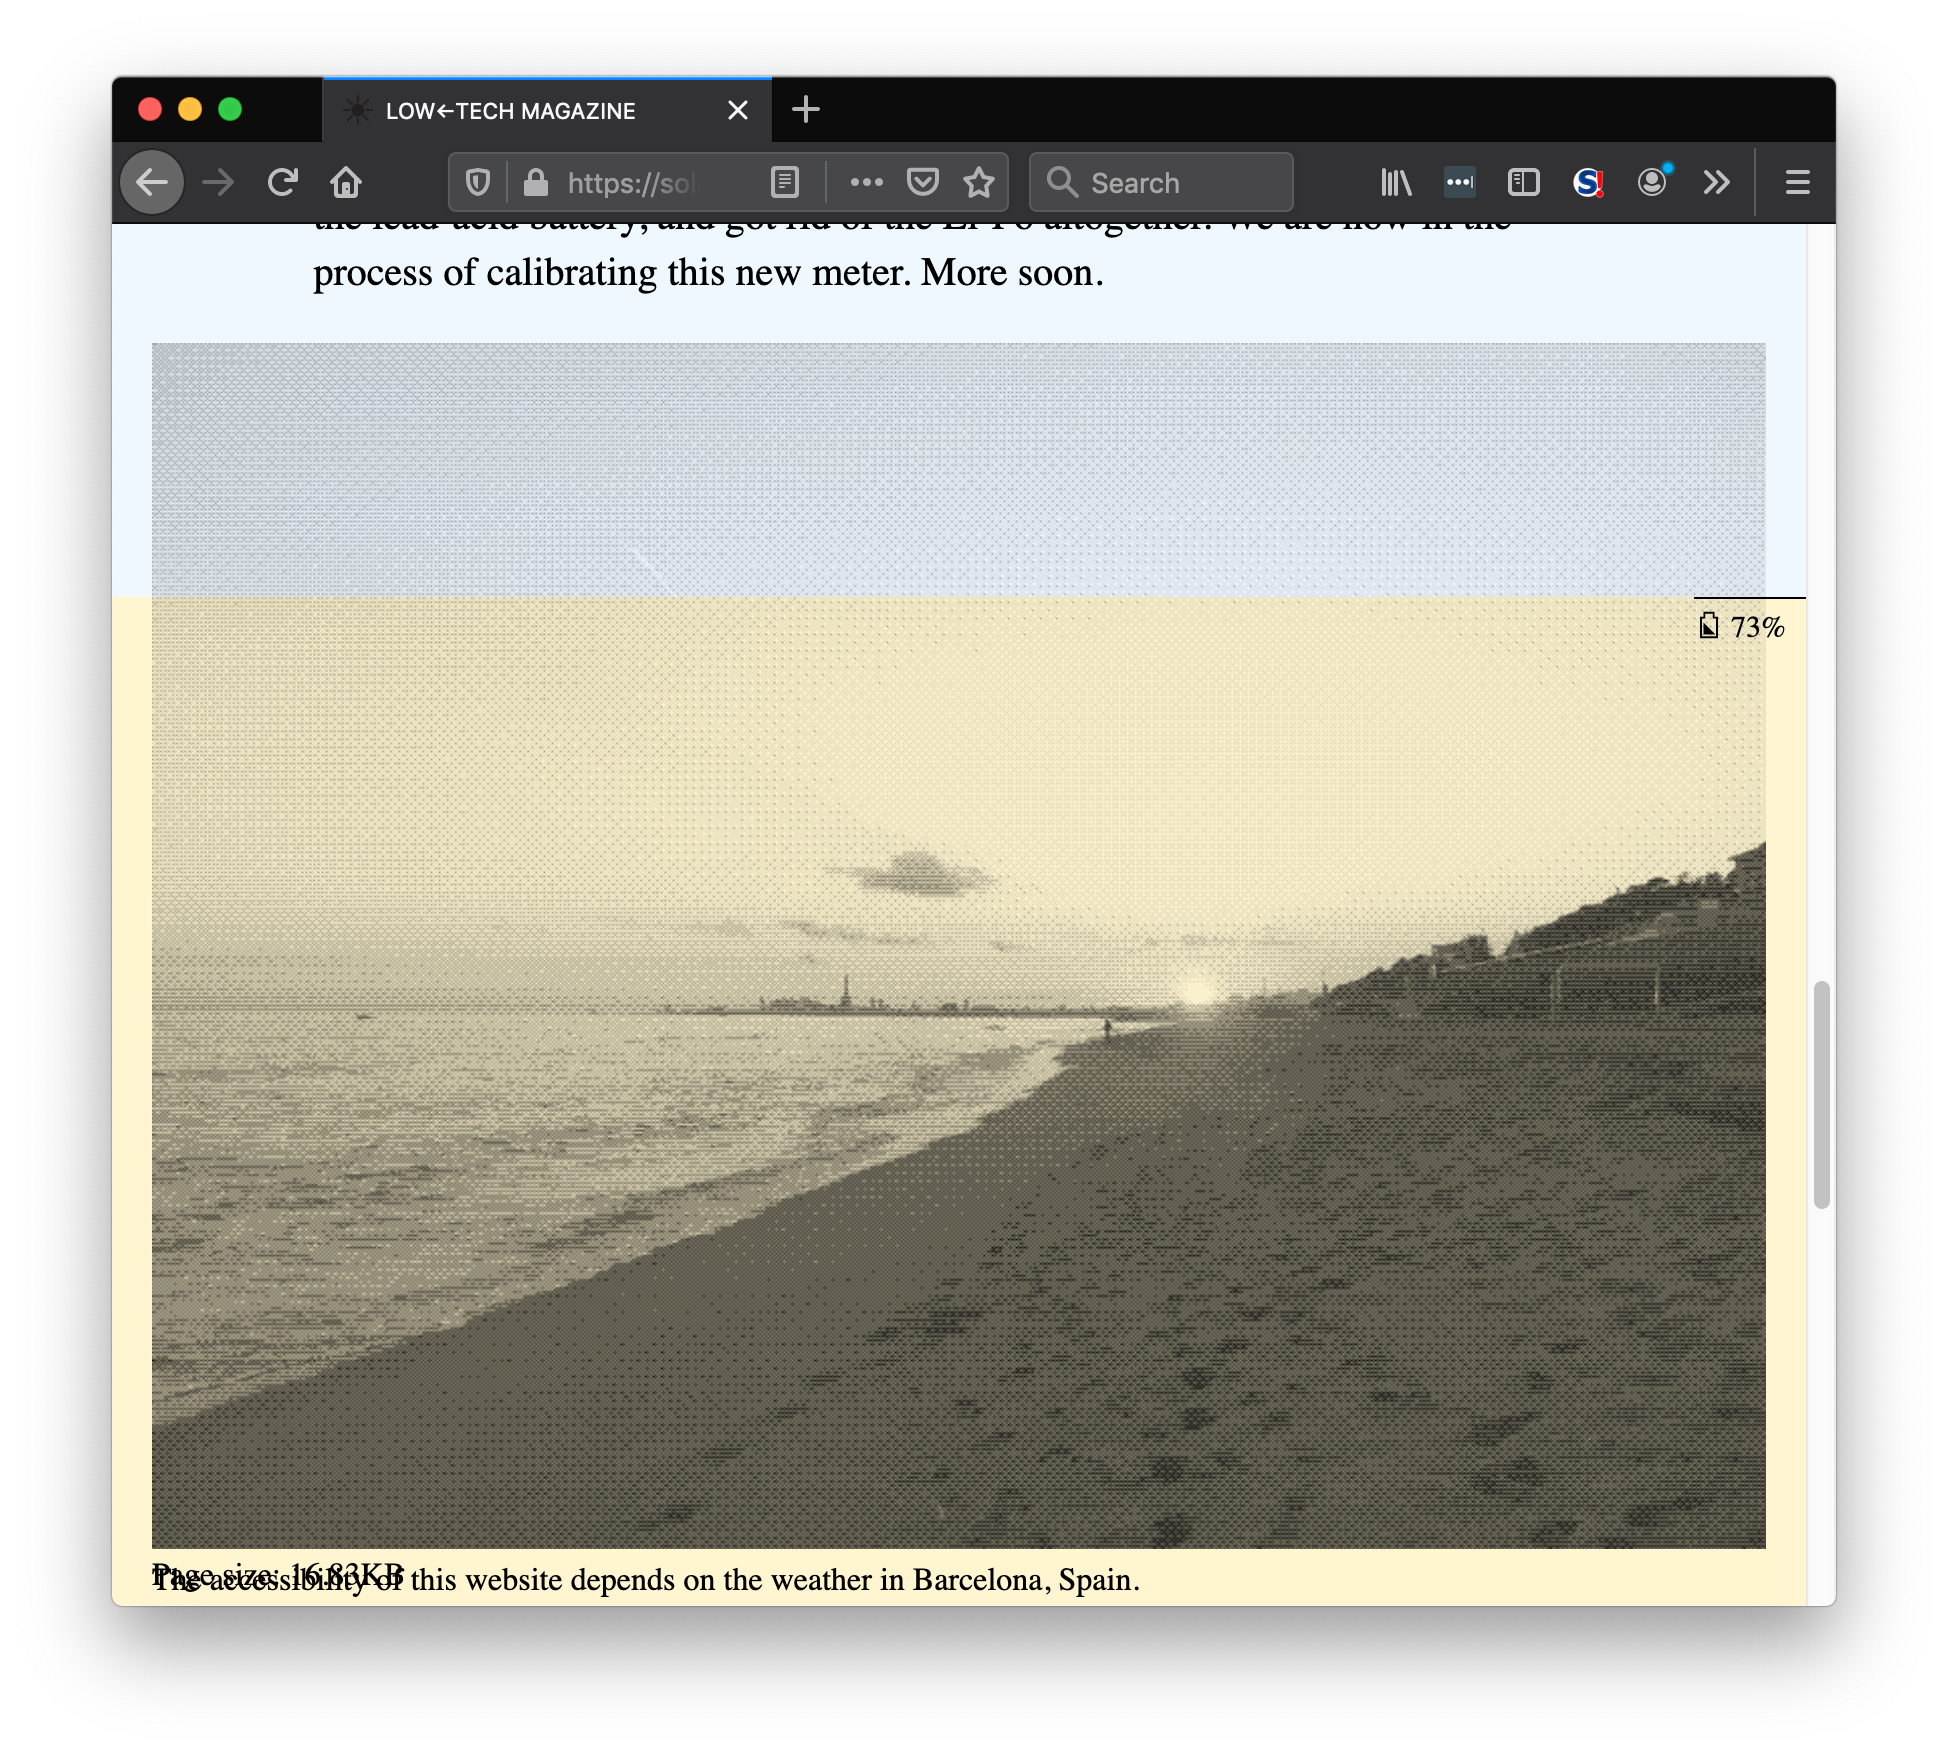
In 2019 Kris De Decker, Roel Roscam Abbing, Marie Otsuka, and Lauren Traugott-Campbell created the solar edition of Low Tech Magazine's website. You can read more about the in the solar site itself.
Their approach was to develop both, hardware and a software stack that allowed them to create a site that can serve thousands of readers, while running on a SoC board and a small solar panel. A completely self-contained system. Let's go over some of their design decisions.
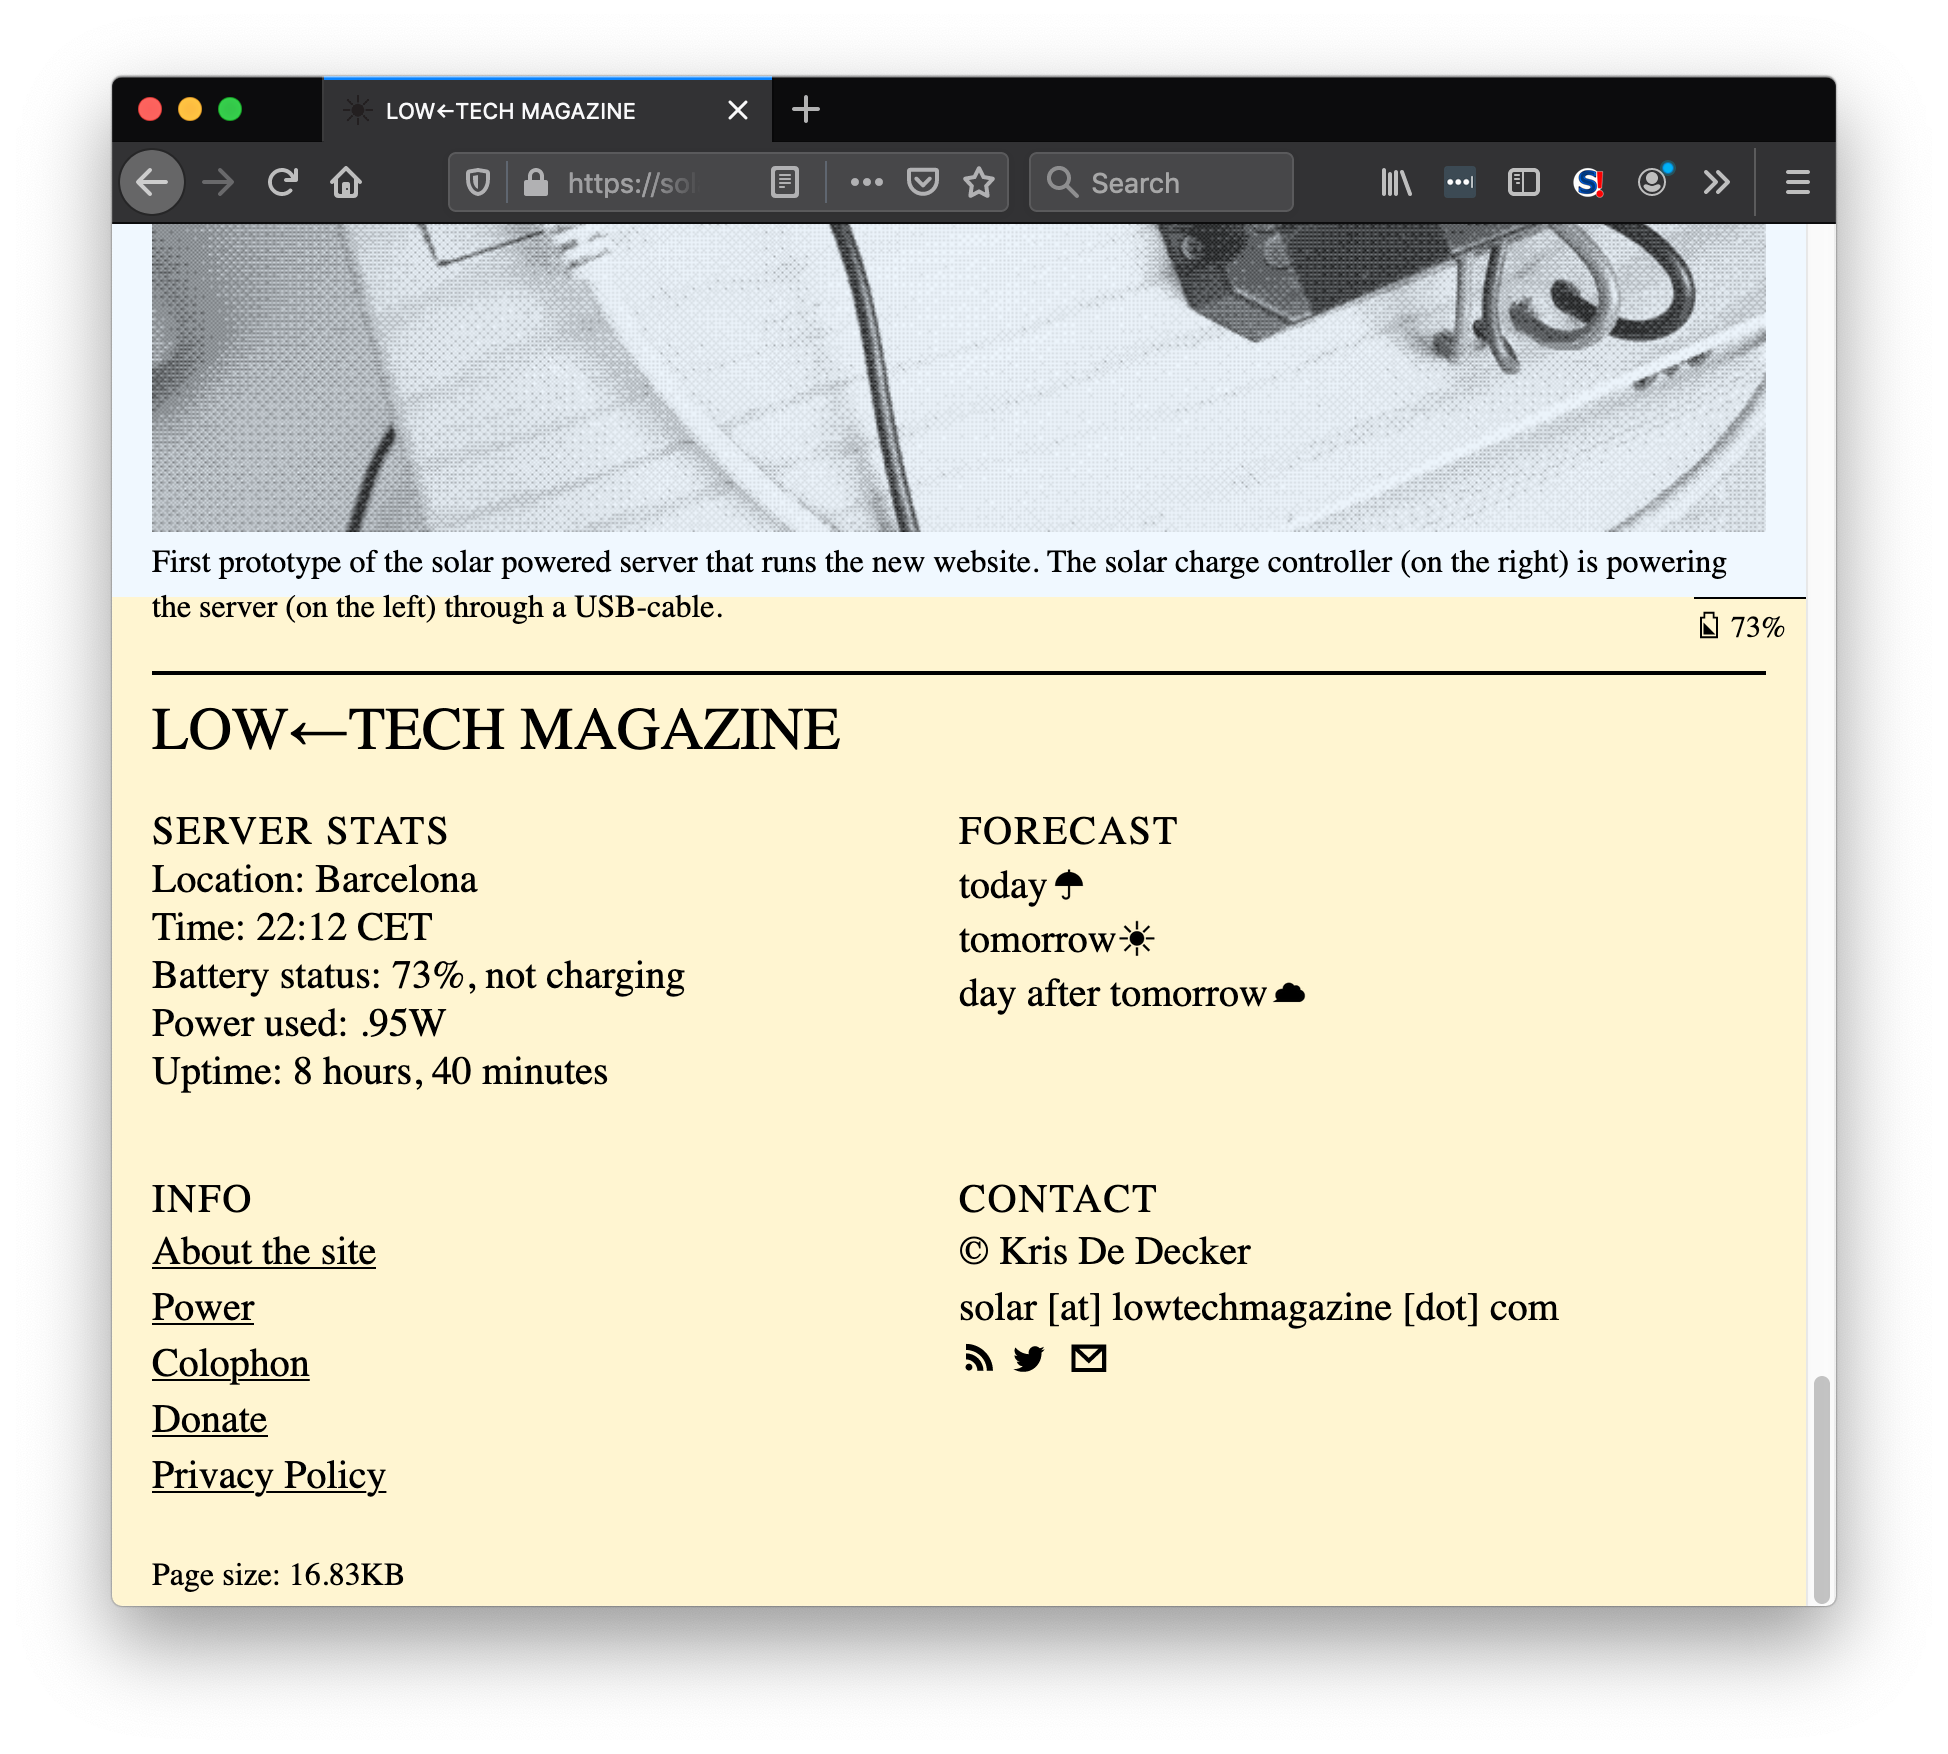
In the process of doing the redesign they also realized that they couldn't continue running google ads, because that made them goover their energy budget.
Case study: CO2GLE by Joana Mol
from: http://www.janavirgin.com/CO2/CO2GLE_about.html
"40% of the Internet’s total carbon footprint may be attributed to the design of a web site. According to recent studies, Internet is responsible for the 2% of CO2 of global emissions, more than that of the aviation industry [1]. On average, the production of 1 kWh emits 544 gr. of CO2 [2]. It takes 13 kWh to transmit 1GB of information [3], the equivalent of 7,07 kg. of CO2. Following a study executed by CISCO, the estimated number of the annual global Internet data traffic in 2015 will go as far as 966 Exabytes (1.037.234.601.984GB) [4] and is expected to reach 1579,2 Exabytes by the end of 2018 [5].
Google.com is the most visited site on the Internet [6] and weighs nearly 2MB. The site processes an approximate average of 47000 requests every second [7], which represents an estimated amount of 500 kg of CO2 emissions per second."
Case study: CryptoSauna
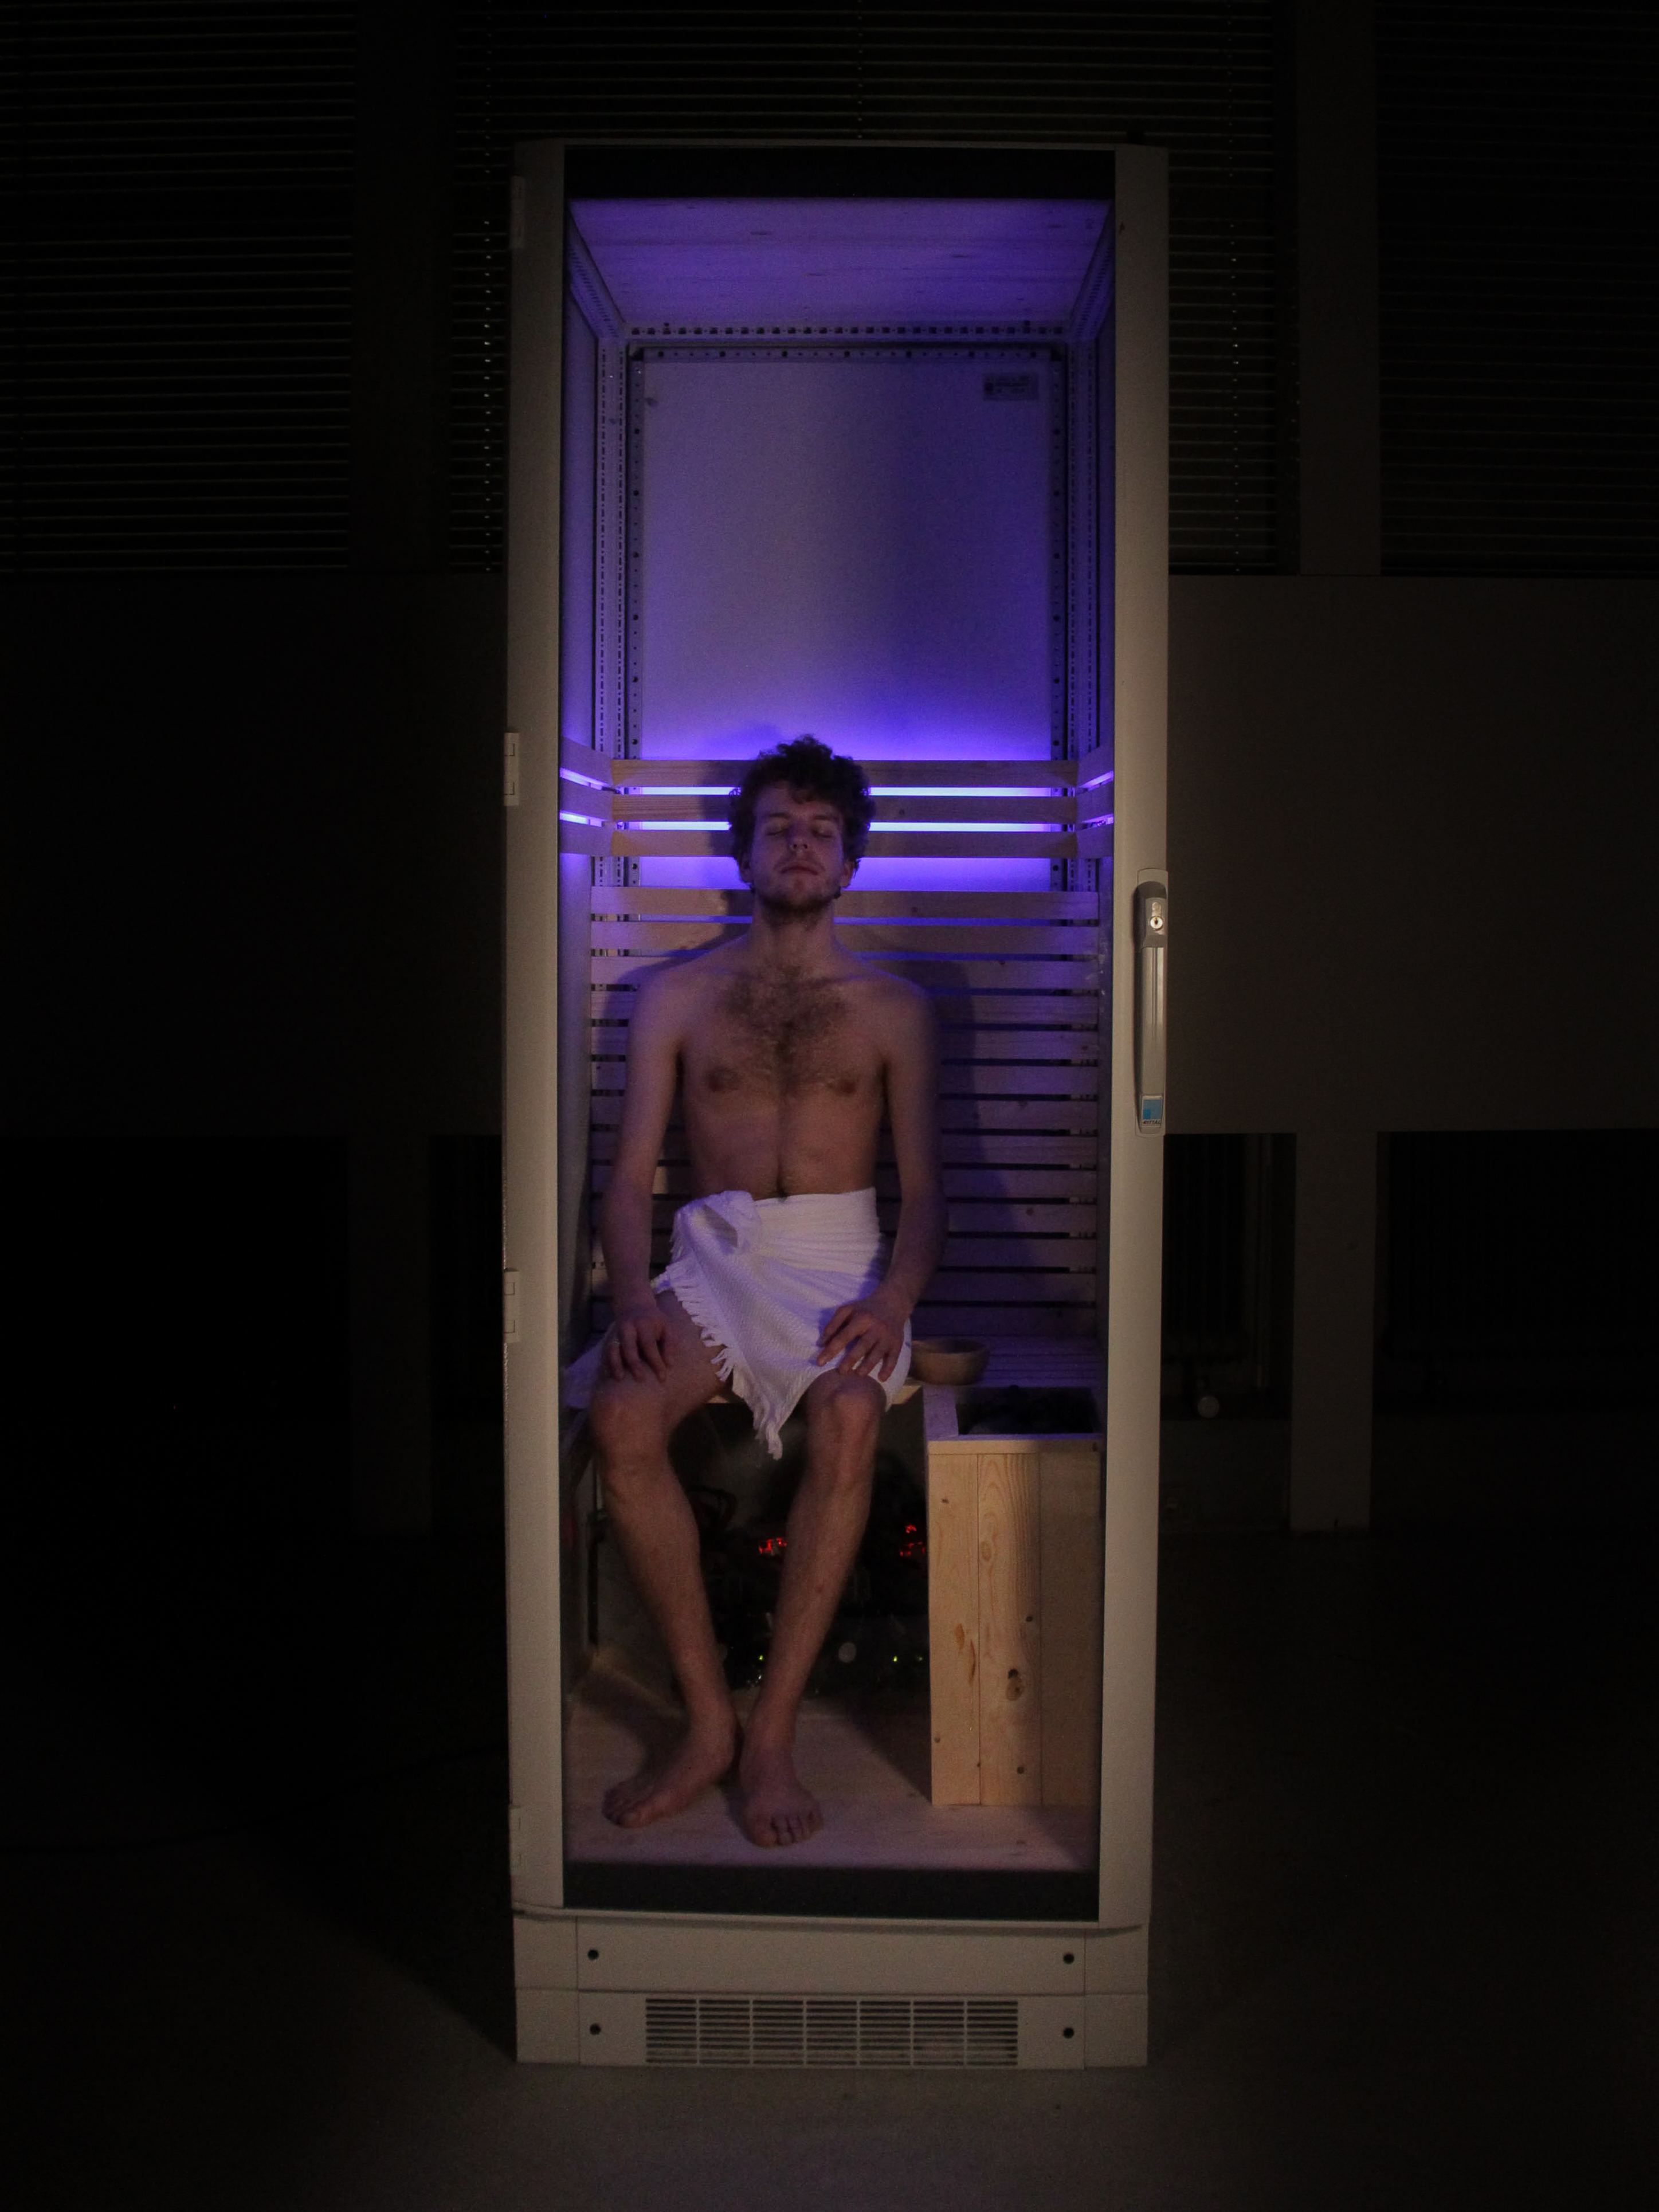

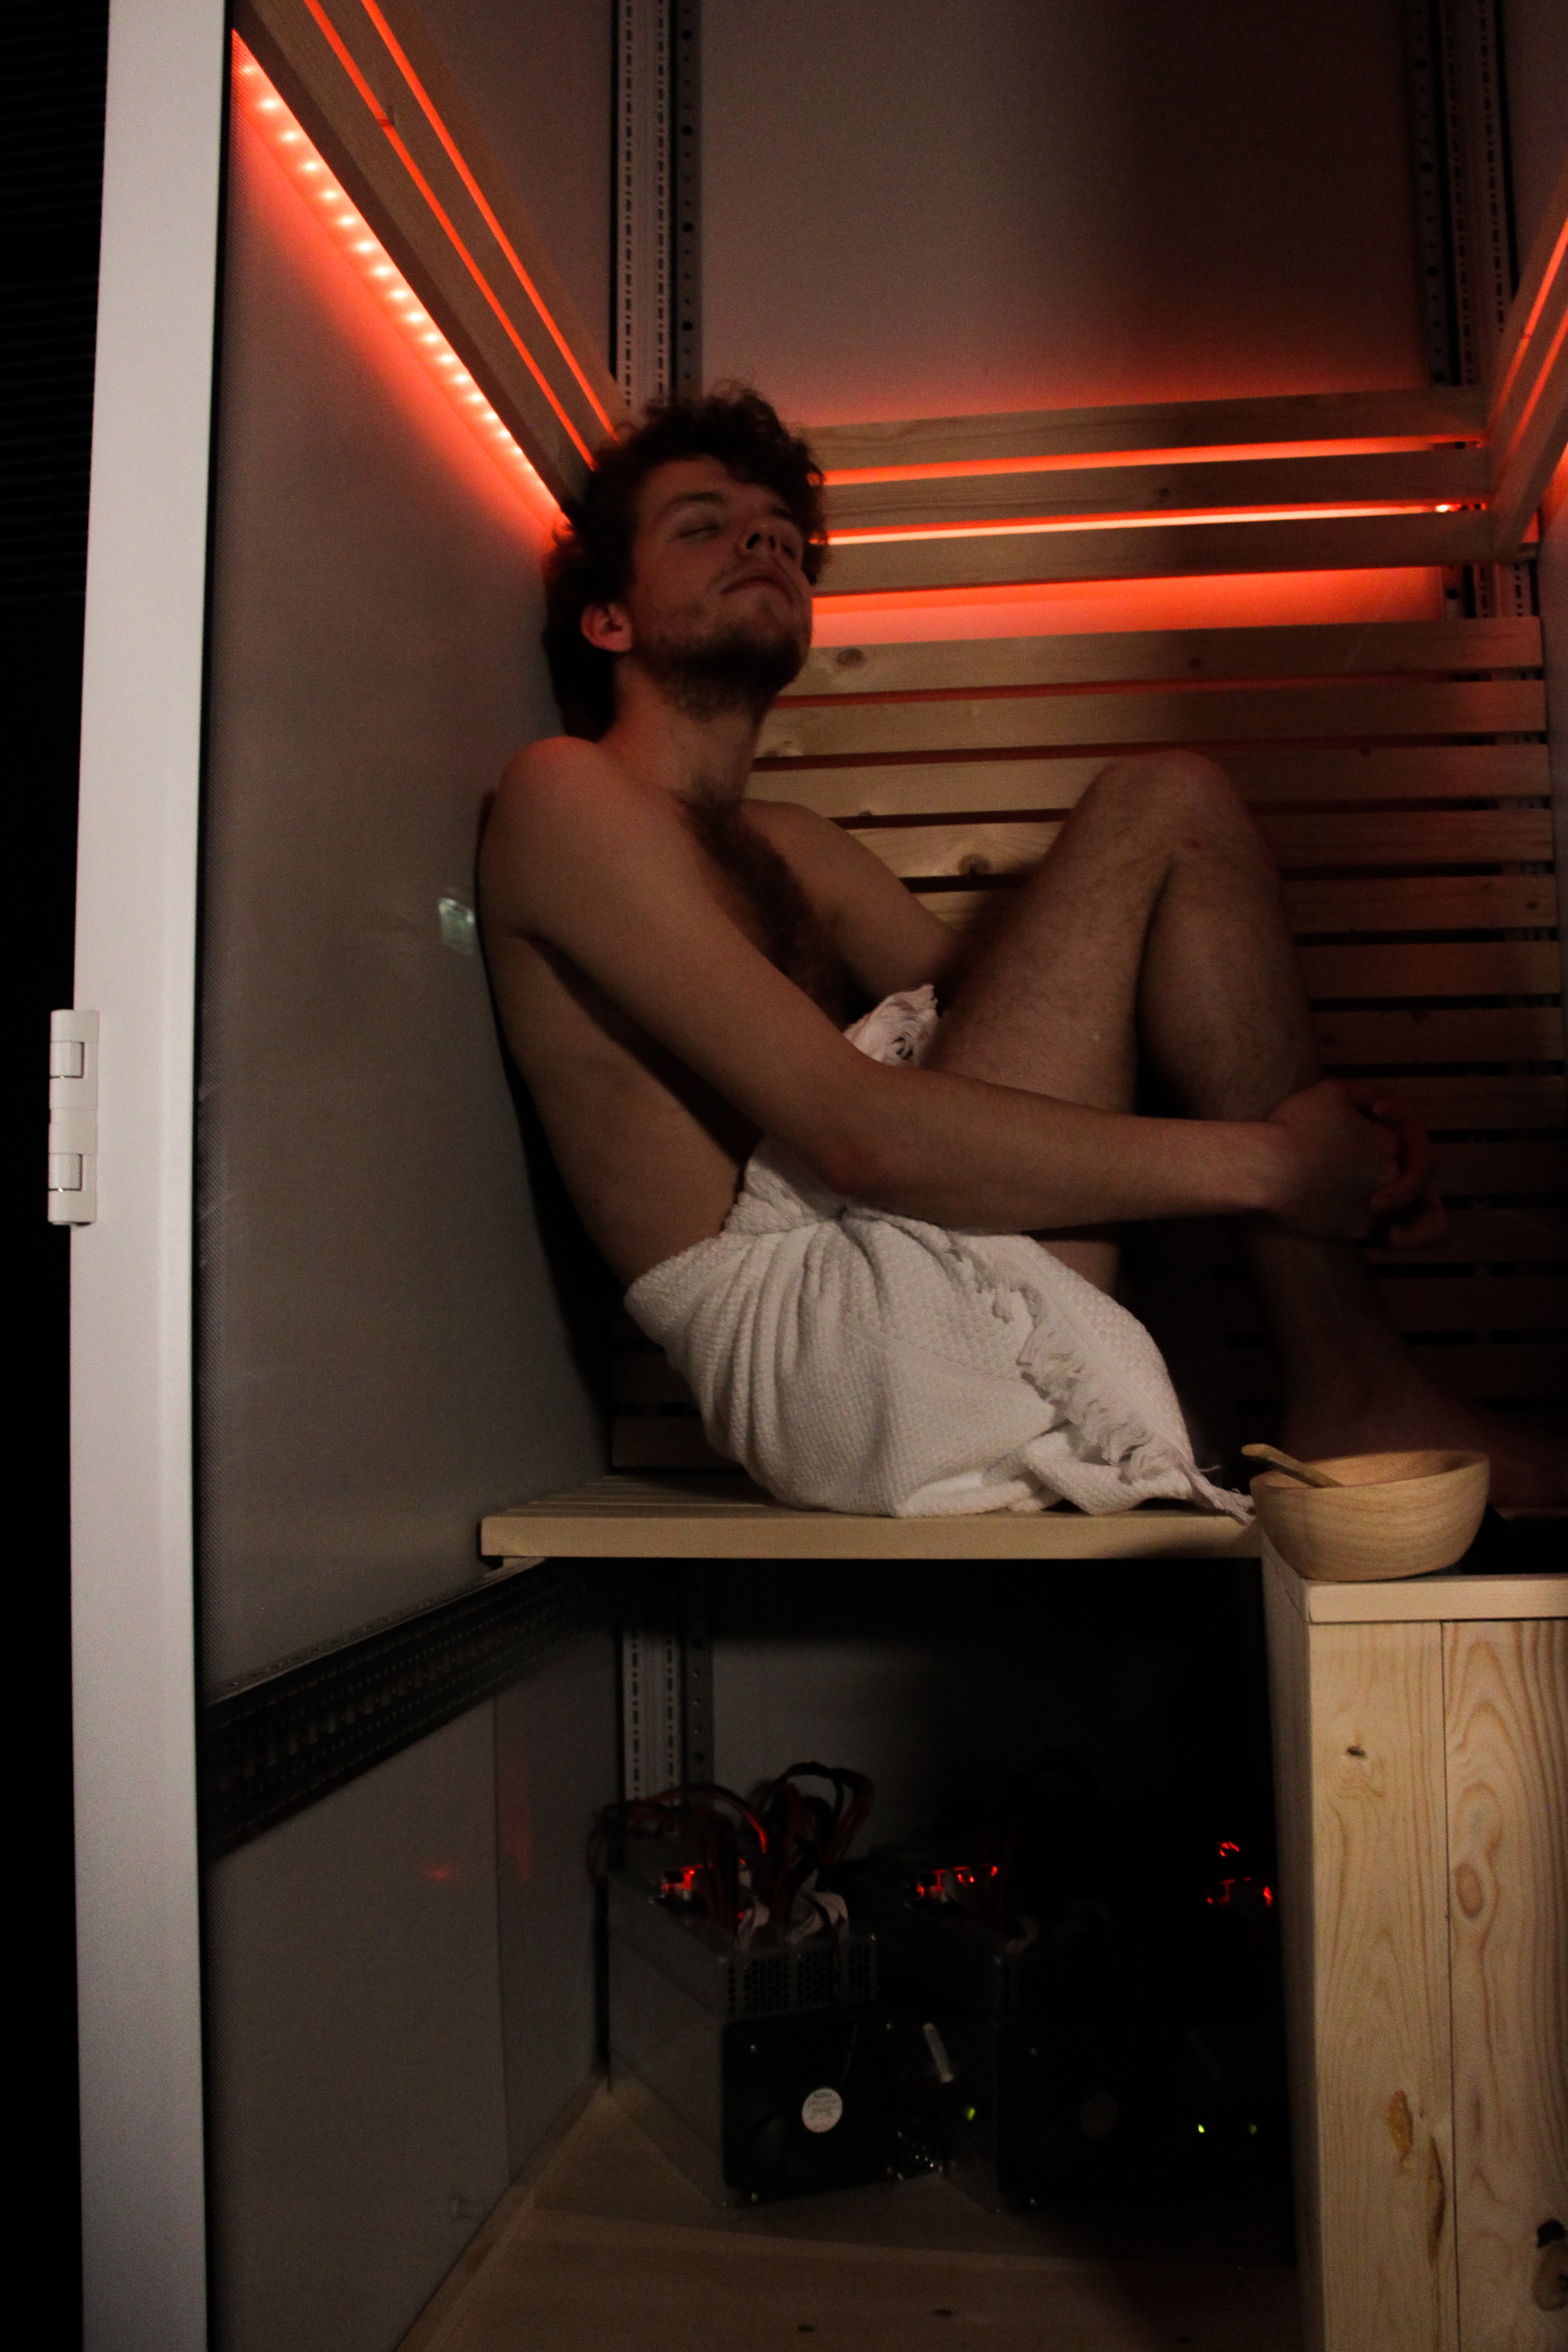
CryptoSauna was made by students of the ArtEZ University of the Arts, Interaction Design department during the Behind the Net project month 2020. Work by Jieppe van Liefbroer, Jonas Westendorp, Aafje van Grieken. Modelling by Bram Wientjes and video by Dieuwertje Boekholtz.
Critically assessing a design
- How media heavy is the resulting design? (e.g. Page Weight Budget)
- What is the impact of my design if 1000 people use it? how about 1M people? and 10M people?
- How much javascript must be executed before the page is fully rendered?
- Are there any auto-play videos? or full-screen video backgrounds?
- How many advertisers and trackers are embedded? How can they be minimized?
- How many requests are necessary to complete a full page load? Can any of these resources be inlined?
- Is it using a CDN (Content Delivery Network)?
- Is it hosted in a facility that uses renewable sources of energy?
- Are the media files optimized for streaming transfers?
- What are the peak hours of usage? Can the content adapt to demand?
- What devices are supported and how resource-heavy is the design when accessed through each device?
- Is there a text-only version of this work?
- What are the choices offered to the user? How sustainable are they? (e.g. shipping a product, can I chose group shipping for specific delivery points?)
Questionnaire to help develop roadmaps for sustainable design.
Figures used in this write-up
- Aviation industry produces about 830 Mt CO2
- Energy used per gigabyte: 0.6 kWh/Gb (in transfer)
- CO2 emissions per kWh: 0.28307 kgCo2e/kWh [2]
Conclusions
- Data moves from place to place thanks to the work of electricity-powered machines, this consumes energy that emits CO2 if it doesn't come from renewable sources
- There isn't yet a reliable model for energy modeling in interactive applications
- The field of Sustainable UX is in its infancy, there's still a lot that needs to develop
- The energetic impact of a digital product is hard to assess because of the many parts involved in the delivery of such product
- Providers of digital services are reluctant to publish their findings for fear of competition given the lack of emission certification standards
- Digital video streaming has by far the most negative impact on emissions
- As a designer consider delivering an emissions budget together with an advisory as part of every proposal you make
Exercise #1
Given the notion of the energy budget that was just discussed.
Work with your group (same as client project) and pick one of these tasks to work on:
- choose a digital product that you use regularly and investigate what is its energy budget, what could you do to lower it?
- work on an energy budget for the client project that you are working on
- what can you do as an individual to lower your digital footprint?
Exercise #2
Work on a CO2 emissions budget for your client project by adding a slide to your next client presentation that covers the topic of emissions.
- What is the impact of the product you are working on?
- What is a reasonable carbon budget for this product?
- What can you do to start this conversation with our client?
- What is the impact of this digital product as it scales? (i.e. What is it with 100 users, 1000 users, 100000 users, 1M users?)
- What is your advice so that this impact is managed?
You can use these references for your work:
-
Pihkola, H., Hongisto, M., Apilo, O., & Lasanen, M. (2018). Evaluating the energy consumption of mobile data transfer-from technology development to consumer behaviour and life cycle thinking. https://doi.org/10.3390/su10072494
-
Aslan, Joshua & Mayers, Kieren & Koomey, Jonathan & France, Chris. (2017). Electricity Intensity of Internet Data Transmission: Untangling the Estimates: Electricity Intensity of Data Transmission. Journal of Industrial Ecology. https://doi.org/10.1111/jiec.12630
Acknowledgements
I would like to thank my colleagues at Greenhost, which have been working to make the web carbon-neutral and beyond for more than a decade now.
Part of this lesson plan is inspired by a talk by Niklas Jordan, particularly the angle of making the argument from the perspective of a UX designer. I borrowed a few of the graphics from his slide deck.
The 2019 edition of the Chaos Communication Congress Resource Exhaustion has also been an inspiration and source for some materials.
Footnotes
- [1] Nicole Kobie, "YouTube's carbon footprint is huge, but smarter web design could fix it", https://www.wired.co.uk/article/youtube-digital-waste-interaction-design
- [2] myClimate flight emissions calculator and AtmosFair
- [3] sources: https://sustainability.google https://green.googleblog.com/2011/09/how-our-cloud-does-more-with-less.html https://green.googleblog.com/2011/09/sometimes-greening-google-means-getting.html
Sources
- Write-up by Danny van Kooten on how he is reducing the carbon footprint of his wordpress plugins.
- Amazon Web Services, Inc. “AWS & Sustainability.” Accessed January 22, 2020.
- Dutch Wikipedia stats
- Chris Preist, Daniel Schien, and Paul Shabajee. “Evaluating Sustainable Interaction Design of Digital Services: The Case of YouTube.” In Proceedings of the 2019 CHI Conference on Human Factors in Computing Systems - CHI ’19, 1–12. Glasgow, Scotland Uk: ACM Press, 2019.
- Aslan, Joshua, Kieren Mayers, Jonathan G. Koomey, and Chris France. “Electricity Intensity of Internet Data Transmission: Untangling the Estimates.” Journal of Industrial Ecology 22, no. 4 (2018): 785–98. https://doi.org/10.1111/jiec.12630.
- Steinberger, “Teaching Climate Science & Action — the 4–7 Year Old Version.”
- Methodology used by the https://www.myclimate.org calculator
- "The Megawatts behind your Megabytes"
- In 2018 Netflix used 245000 MWh (51000 MWh directly and 194000 MWh indirectly), that's 7.7 times more than the entire electricity consumption of Guinea-Bissau a country of 1.7M people, https://media.netflix.com/en/company-blog/a-renewable-energy-update-from-us
- Tim Frick, Designing for Sustainability
- Click Clean Report, Greenpeace
- The Cost of Mobile Ads
- Stanford Seminar - IPFS and the Permanent Web, Juan Benet
- Cloud Sustainability Console, Chrome Extension
- The State of Data Centre Energy Use in 2018
- “‘Tsunami of Data’ Could Consume One Fifth of Global Electricity by 2025.” The Guardian, December 11, 2017, sec. Environment.
- Why a Low-tech Website?, Low Tech Magazine, https://solar.lowtechmagazine.com/about.html
- Data Center Murals project by google to decorate their datacenters.